

Barky's Diagonal Entry Model
The Ultimate Trend Trading Tool

Barky’s Diagonal Entry Model turns the dream of catching reversals into reality. By identifying failed continuations, it pinpoints the earliest reversal entries using precise EMA9 trend signals. With disciplined position management, the model secures consistent profits for a sustainable living while allowing runners to grow into potential swing trades. A rules based trading system, leading the way towards consistency and great days.

Diagonal Entry Model: Concept Outlines
Price action is binary, continuously fluctuating upward or downward while progressing sideways over time. This process creates pivots that we recognise as higher highs, lower highs, higher lows, or lower lows and fundamentally defines trend.
The key to market behaviour lies in the elegant interplay of these higher highs and higher lows, seamlessly integrated with the EMA9, organically shaping the EMA9 as a dynamic reflection of price momentum.
When price is trending, every time it retraces to test the EMA9 and encounters support, Barky’s Diagonal Entry Model facilitates a risk-informed opportunity to participate in the trend’s endeavour to validate EMA9 support by forging a new high (continuation). At the same time, this EMA9 parameter also provides the earliest possible signal when continuation falters, enabling traders to define risk and participate in the earliest stages of reversals.
Diagonals Lead the Way
There is no way to casually draw a resistance or support line. Price action is geometry and always provides clear and absolute rejection points. Trend lines, channel boundaries and other diagonals are absolute.
To draw relevant diagonals we have to observe higher highs, lower highs, higher lows and lower lows. All of these confirm when the next candle breaks the previous candlestick’s high or low, disrupting an advance or decline that was previously in progress.
For clarity, here is a chart with all relevant pivots highlighted.

Pivot Rule: to draw diagonals, we have to find highs and lower highs, lows and higher lows that connect lines without other candlesticks crossing through them. Clean, uninterrupted diagonals.

Price action typically leaves behind lots of pivots to connect.

In the DTF universe, these are called “algo diagonals” - they account for price and time to form geometrical reaction points when price tests them. Algo diagonals hold no predictable power. When price reaches them, the reaction is consistently one of three possibilities: reverse, consolidate, or accelerate. This is where the EMA9 comes into play.

Relevant Diagonals
Now that you understand the parameters that allow you to draw diagonals, lets have a look at the three diagonals that will change your life:
TCD - Trend Control Diagonal - tells us when expansion is showing early signs of exhaustion and initiates a consolidation or retrace into the leading EMA9;
BoT - Break of Trend - when the TCD is broken, price will attempt to seek the trending EMA9 for a backtest, either through a bounce or sideways consolidation;
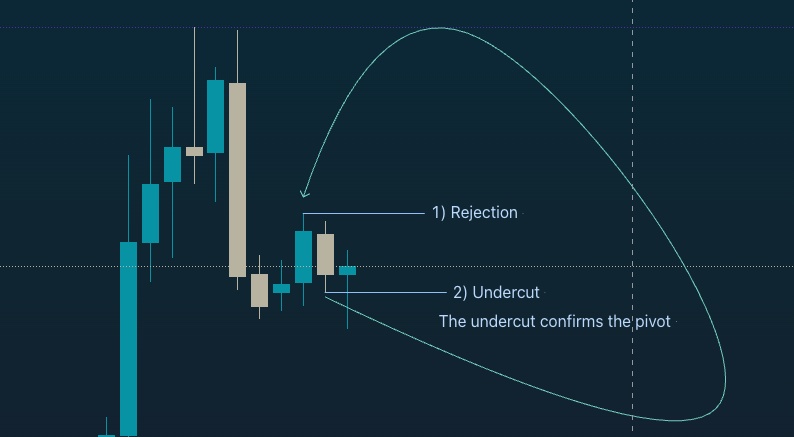
ECD - Entry Control Diagonal - can only be drawn after price has made a lower high towards the trending EMA9, and becomes higher probability after actual EMA9 rejection. The ECD tells us if EMA9 continuation is succeeding or failing, initiating a reversal attempt;
Entry Diagonal - the risk informed level above or below which a trade initiates.
All other diagonals that were not involved with the setup become ‘target diagonals’ - and we have to anticipate one of the three possible reactions as price reaches them.
1. Trend Control Diagonal - “TCD”
When price breaks a range and follows through, we can draw a diagonal from the breakdown candle along the candle highs that follow. As a rule, breaking this TCD initiates a bounce or consolidation into the leading EMA9.

You can place an alert on this diagonal - because when price breaks it, it announces the earliest stage of exhaustion and initiates price discovery. The target for this Break of Trend is the leading EMA9, either sideways or via a bounce. The Diagonal Entry Model can only set up AFTER this bounce and AFTER the leading EMA9 has rejected price.
2. Break of Trend - “BoT”
In other words, when the TCD is breached, it becomes a BoT (Break of Trend) to announce that price is seeking the trending EMA9. This is called the EMA9 parameter and the entire system depends on it.
