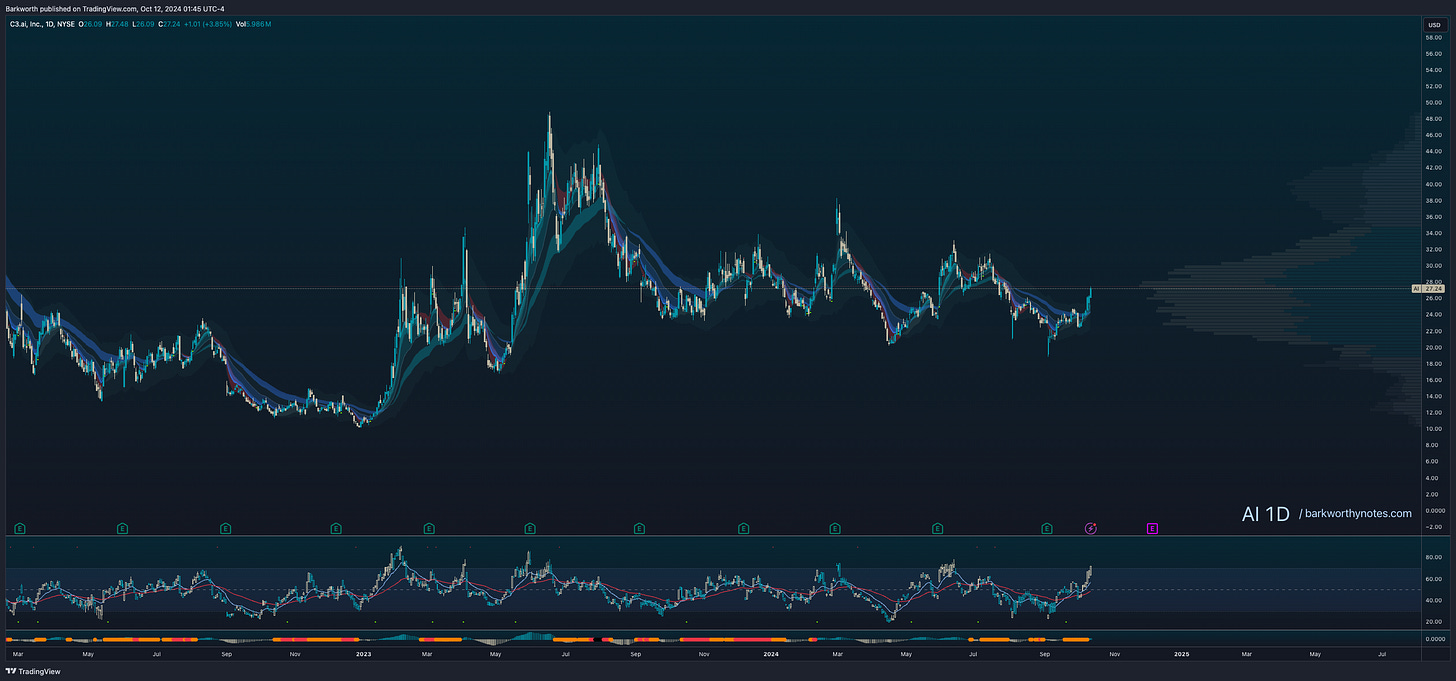
Base Box Timing Applied
Simplifying intra timeframe awareness
Price action is geometry. We know this, because this is one of the first things people tell us when we ask why FIB retracement works in both time and price. I have explained my concept of Base Box Timing in the previous instruction, to explain how we can derive a timing aspect that takes its repeatable parameters from an EMA50 contraction. If you have missed that one, here is the link:
Base Box Timing and the EMA9/50 Dynamic
The Base Box Timing instruction explains how the dynamics between the EMA9 and the EMA50 allow us to anticipate specific events at specific locations in time. I go on to explain that a base box at degree (the timeframe where it forms) is a higher timeframe EMA50 box. The latter is our entry into market geometry, because this higher timeframe EMA50 box is subject to the same rules that apply to all EMA50 boxes. If it succeeds, a trend forms. If it fails, price will start basing on this timeframe too, and continue to expand the sideways structure.
In this article, I will show a simple example of how to quickly apply the Base Box Timing concept in real time, and I promise you, once you understand how to draw the Flattening stage from the bottom/top pivot the the Dual Break Fail, that is really all you need.
Simple Geometry For Probability
This is not going to be the holy grail, and it is not going to be something magical. Price leads, and although concepts are repeatable, when EMA9 fails to hold, the setup fails and we wait for the next opportunity.
All I want to do here, is show that I have engineered concepts that fit together in sequences that work together to give us insights into intra timeframe relationships as tools to aid us in our interpretation of charts, price action and probability. If you have a mind that is pattern orientated, and you understand concepts of probability, you will appreciate how these intra timeframe relationships help us narrow down specific moments in price action where directional moves may take heart, and all we have to do then, is patiently wait for the perfect shot, and then execute in line with my parameters for risk and position management.
With all concepts combined and mastered, you can literally narrow down a monthly break out to a 5 minute entry to get a $1000 move with a $3 stop. To me, that has always been the ultimate challenge. I first noticed that it was possible when I explored lower timeframe entry models while keeping my eye on higher timeframe price structure. I was unable to frame it at the time, and some of you remember my original Base Box Anatomy concept - I should perhaps move it to a museum section. My work has since come full circle, and I feel blessed to be able to share my findings with you today.
Intra Timeframe Relationships
The only way to explain the point of this instruction is to demonstrate it. We’ll take a random chart, and it is a choppy mess.
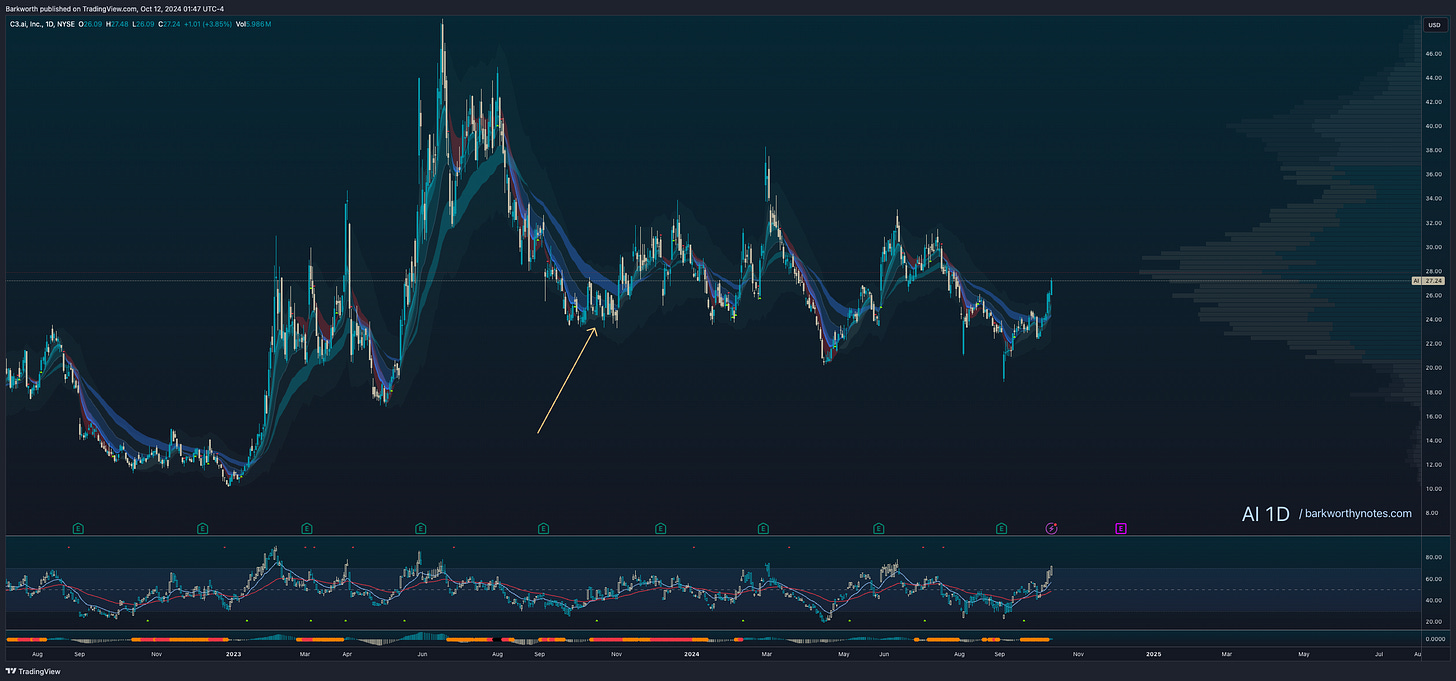
We can zoom out to find something we understand, but zooming out won’t give us details. Details have to come forward from a timeframe that we can trade. This is the daily chart. The one thing that stands out, is this D1 EMA50 box right here:
It stands out because it formed in the middle and failed to produce a trend. There are other points of interest on this chart, but they date further back in time and hold no relevance for the current sideways price action.
That EMA50 box appears to be the responsible area, so that is our entry into the geometry of this chart.
The base box sequence formed, played out in line with our parameters, and after the third EMA9 reversal, no EMA50 box formed to confirm the directional break. A base box is a higher timeframe EMA50 box, so when a directional break doesn’t materialise, the higher timeframe EMA50 box is likely failing, forming a base there, and expanding our base box further sideways.
On the chart above, you see that I have drawn a red box to mark the time that was used from the bottom pivot to the third EMA9 fail. This is easy. Even easier is to duplicate this box sideways and rename them Flattening, Converging and Maturity.
Like this:
Now we zoom out to explore the relationship with the higher timeframe. We were watching a D1 Base, so that had to be a W1 EMA50 box.


