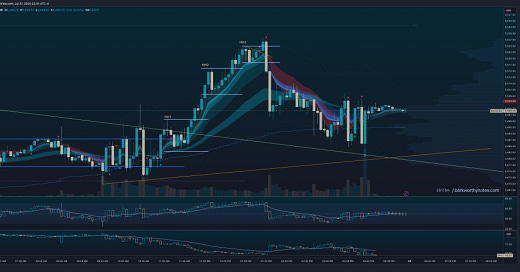
When an EMA9 trend emerges, price typically makes three advances before consolidating or pulling back into EMA50. In traders lingo, these are called higher highs and higher lows in uptrends, lower lows and lower highs in downtrends.
A full trend sequence is HH-HL-HH-HL-HH for uptrends, and LL-LH-LL-LH-LL in downtrends. In other words, five pivots. The simplest way to confirm this, is to trade through an EMA50 break out, and then simply witness price respect EMA9 on pullbacks.
When the underlying trend is strong (the higher timeframes), we can keep adding as long as EMA9 leads. The second pullback announces the start of the third and final advance before price is due for a bigger consolidation or pullback, telling us to be cautious when adding into the existing trend.
So how do we know where to place the HH or LL along EMA9 trends? Here is an example.


