Trend is an interesting principle, and misunderstood by many. When price is trending, there is always a majority of retail traders that are betting on a reversal, taking early trades against the trend. This is a mistake, and a recipe for disaster. When you look at a chart and see that price is making higher highs and higher lows, and is above EMA50, then that is the direction you should look to trade. As long as price doesn’t make a lower low to mark a failure swing, and as long as the EMA50 is trending, upside is the direction with the highest probability. Vice versa during downtrends. Only when markets are basing, can we consider to trade in opposing directions from where the market appears to be headed.
As a tool set, moving averages and exponential moving averages are a lagging indicator. How can they not be? Their calculation is based on historical price data, and only gives us the level of the average transaction in the period that has passed. All they tell us, is where traders add to their positions, until suddenly, they don’t. When an EMA loses its trend, price simply stops respecting it, confirming that there are no more transactions happening at this particular average. Something has to happen before traders will respect this EMA again.
The Basic Principle
Therefore, the first thing you have to learn, is how you can spot that an EMA trend is starting, how to confirm that it is still alive, and how to know when is has ended. We’ll have to start with the basics:
The key principle to trend, is the understanding that EMA9 trends originate out of EMA50 consolidations/corrections, and when an EMA9 trend ends, price consolidates or retraces back to the EMA50 on the timeframe where the EMA9 trend first manifested. Then, when price no longer respects the EMA50, the governing trend has ended, and we have to shift to a higher timeframe.
For this first article, I want to share specifically how I confirm trend and use EMA’s to decide if I should cut a position or keep trailing. The same principle applies to SMA’s.
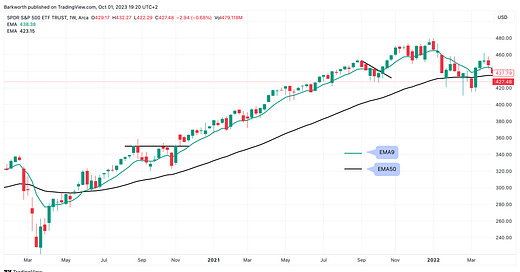
Here is the chart I will be using for this instruction. We have a decent EMA50 consolidation on the left hand side, and it is easy to see that the new EMA9 trend started after a pull back into EMA50. Things always look easy on hindsight, but when following price data in real time, looking for a setup, things are rarely easy to spot. So let me give you the parameters that I use when a setup like this is forming.
First Event: the EMA9 Trend Ends.
Before price can start a consolidation or a pull back into EMA50, the first thing that needs to happen, is that the EMA9 trend ends.
Let me show you in detail what that looks like:
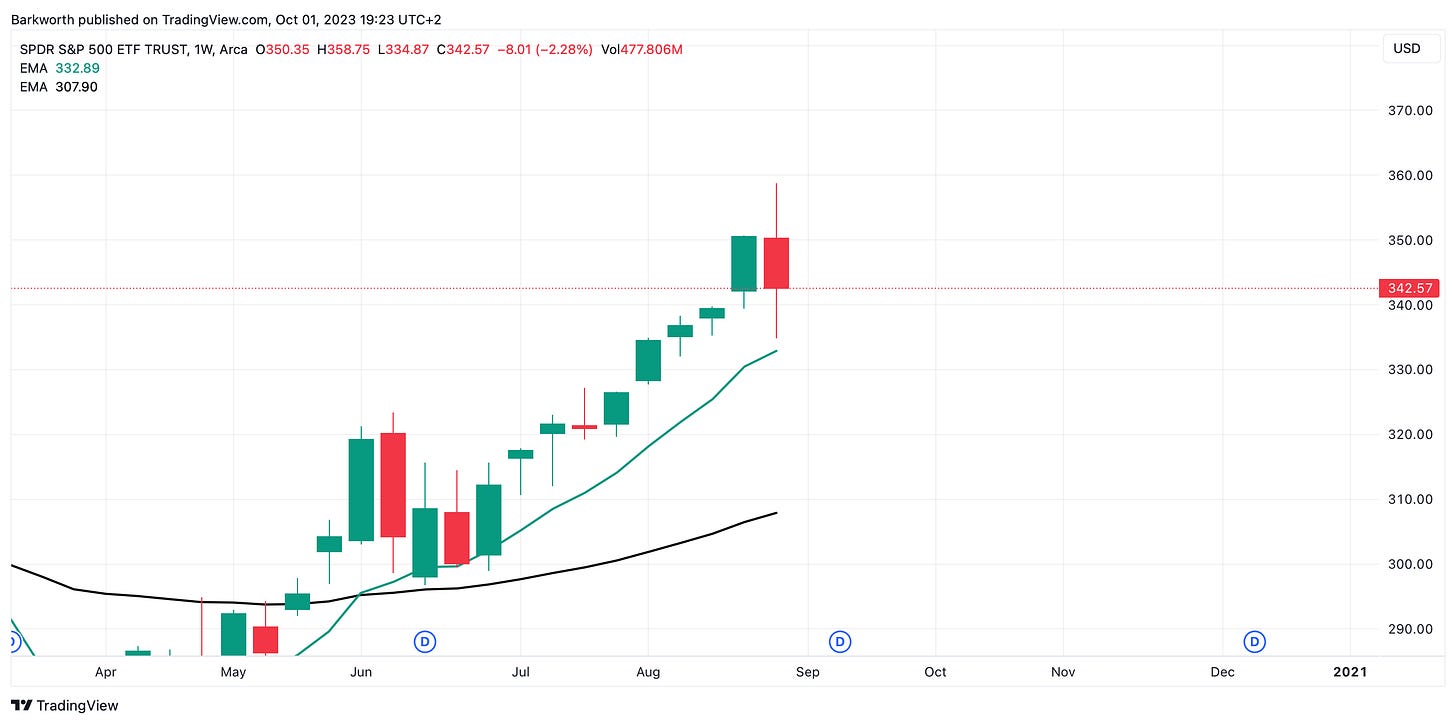
The above chart shows a healthy uptrend. When price reaches a resistance level, the first pull back is always into the EMA9. We see an indecision candle, but price respected the EMA9 on this first test. The candle itself gives us reasons to be cautious, but the EMA9 trend hasn’t ended yet. In fact, there are transactions happening, and price may recover to the upside.


