When you understand the basics that I have explained in part 1 of this instruction, you can afford a deeper look into the trend following principle that I use.
I have explained that EMA9 trends originate out of EMA50 consolidations.
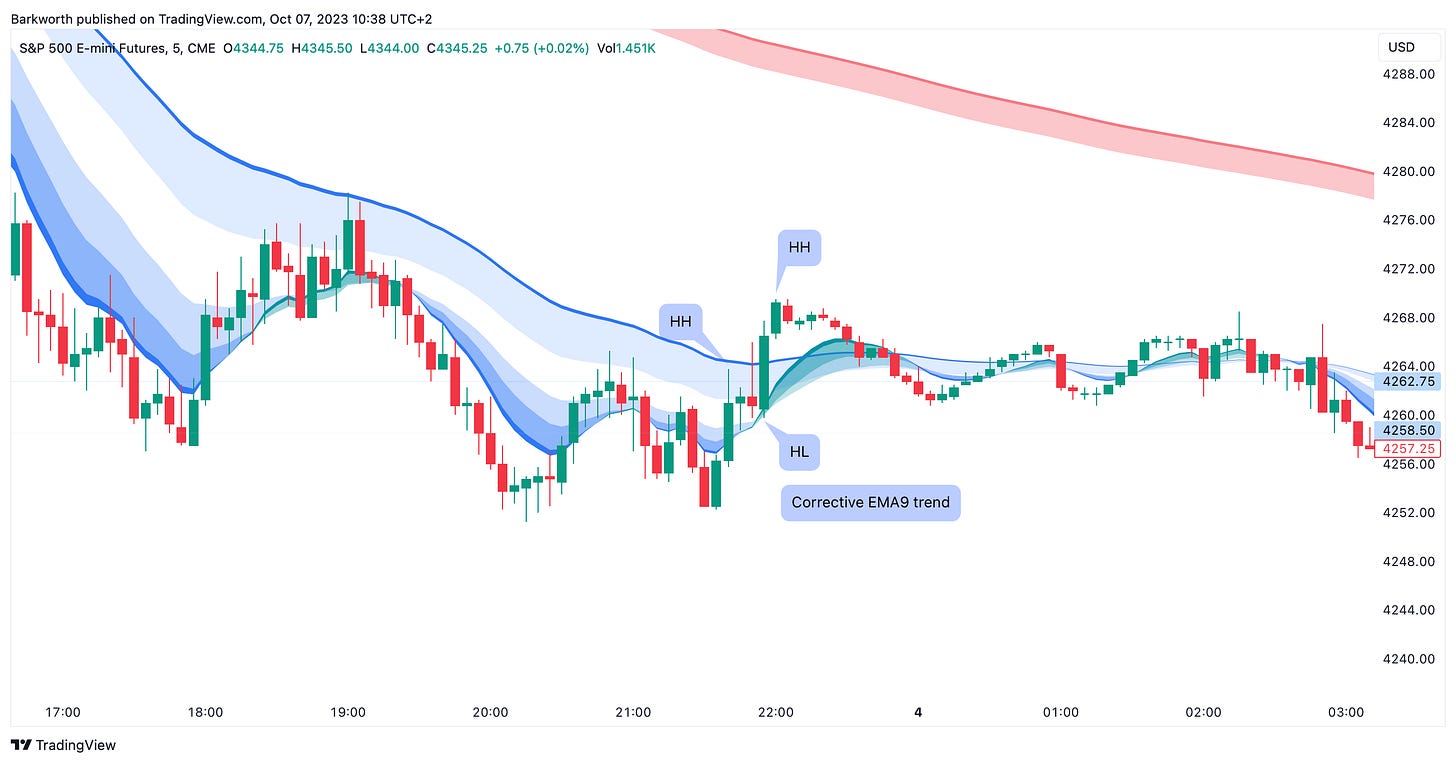
It is important to understand the two types of EMA9 trends that exist: a corrective EMA9 trend and an impulsive EMA9 trend. A corrective EMA9 trend consists of just three pivots (HH-HL-HH in uptrends and LL-LH-LL in downtrends), while an impulsive EMA9 trend produces five pivots (HH-HL-HH-HL-HH in uptrends and LL-LH-LL-LH-LL in downtrends.
Let me show you some examples:
A corrective EMA9 trend forms when the EMA50 fails to produce expansion. Price breaks out and fails to hold the EMA9 when the initial break out momentum fades.
We can use the EMA34/50 for directional bias. In the example above, you clearly see a negatively expanded 34/50 cloud (meaning that the distance between the 34 and 50 is big). When price attempts an immediate reversal under these conditions, the first try nearly always fails. An expanded cloud indicates the need for contraction before a reversal can manifest.
Impulsive EMA9 trends put in momentum candle after momentum candle. The chart below is a fine example of why I use the EMA9 to decide if a break out is working or not:


