


#ES_F / #NQ_F Trade Plan June 16
Mastering the S&P500 and Nasdaq 100 futures with Barky's Three Level Trade Plans

Table of Contents
Previous Day Trade Plan Review;
Chart Updates and Trend Status;
Updated Trade Plans for $ES_F and $NQ_F for the session ahead;
$ES_F Three Level Trade Plan;
$NQ_F Three Level Trade Plan;
$VIX Chart and Levels;
Video Trade Plan - a 15 Minute Trade Plan Explanation;
Education and Previous Session Trades Reviewed;
Methodology.
Here is everything you need to succeed in today’s market!

Session Review
Not your typical weekly OpEx Friday PA although market did push back and forth inside a range. There were two opportunities to get long, both recapped in the education journal in today’s newsletter.
The system gave:
ES: 46 points long;
NQ: 152 points long.
Every day new levels, then the same setup, same concept, same execution. Such is the advantage of a repeatable strategy, a framework for consistent risk management.


D1 - Daily chart update
For the past three weeks I have been talking about the moment that D1 EMA9 continuation would fail, so that we would see the initiation of the daily turn. It finally happened on Friday last week, and my first downside targets $5967 and $21548 were reached as D1 EMA21 set up the bounce for both indices.
Key to the coming session is Friday’s bounce and backtest of H4 EMA9. If buyers reclaim, a backtest of D1 EMA9 is next, and that is where the next rejection (short) should set up. If D1 EMA9 is reclaimed, the weekly break out continues.
The area between the D1 EMA9 and the D1 EMA21 is a typical chop zone, but if the 21 is lost we could see immediate continuation lower, initially targeting D1 EMA50.
This is the dip I want to buy, but price has to prove that buying is a good idea. For now, the uptrend only just ended and if we see some follow through into Monday/Tuesday, an hourly reversal into D1 EMA50 would be the first area for me to try early swings long.

W1 - Weekly Chart Update
We closed the week on indecision. The trend is up, and doji candles can resolve into two directions. If we undercut last week’s low and get hourly reversal setups, it would be a strong buy, at the very least to participate in the search for a daily lower high.
For now, my eye is on a weekly V-Shape setup - slowly forming an weekly inverted head and shoulders pattern, which at this stage is not yet there. The D1 EMA50 box would set it up.
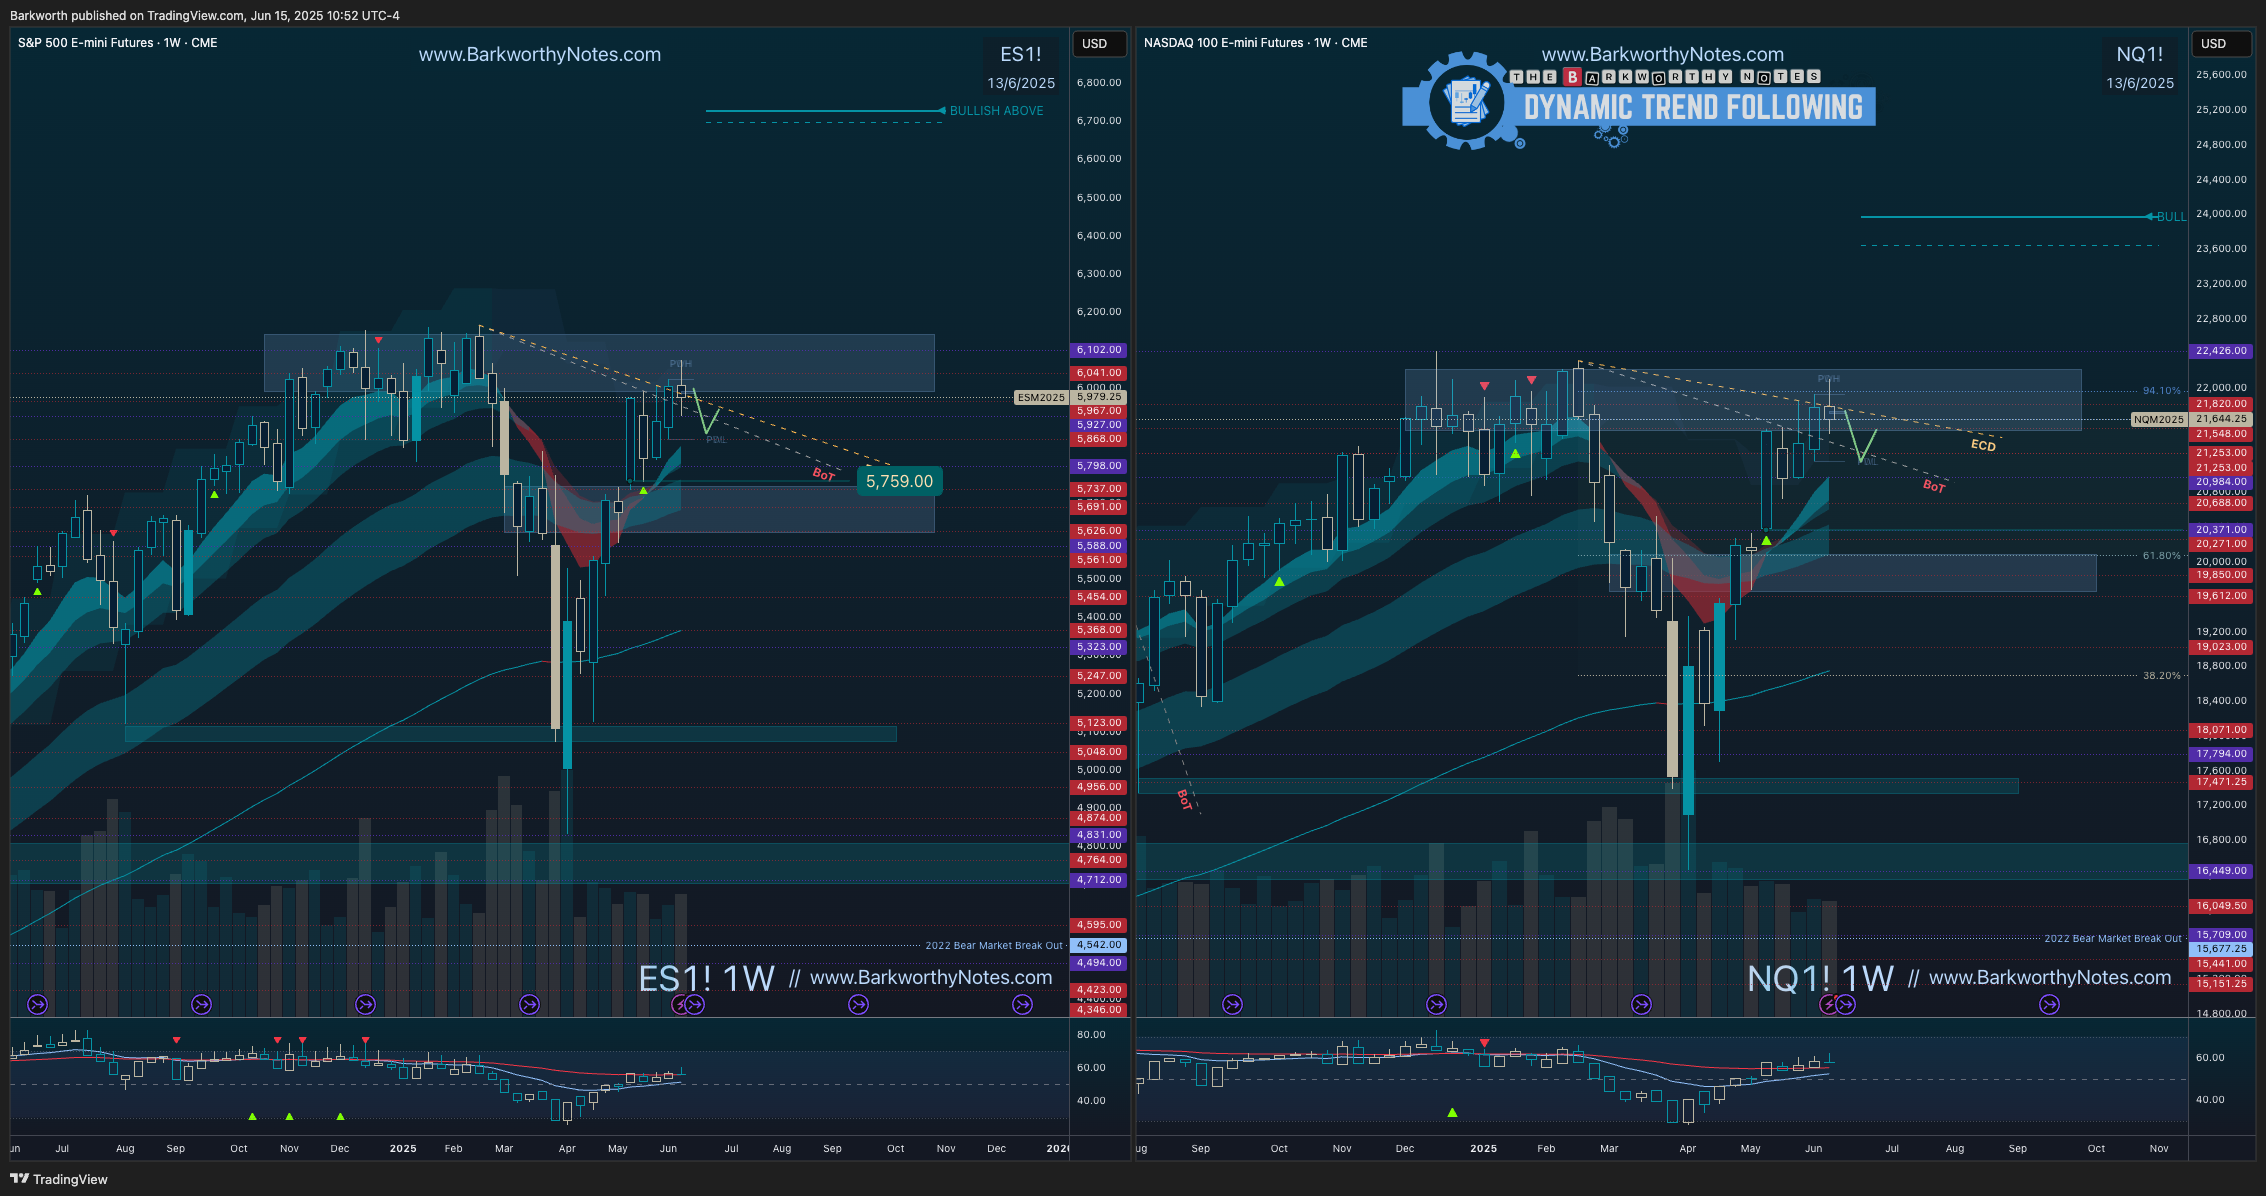
When price touches the weekly EMA21, it consistently aligns with the three week EMA9. W3 is highly effective for filtering macro trends.
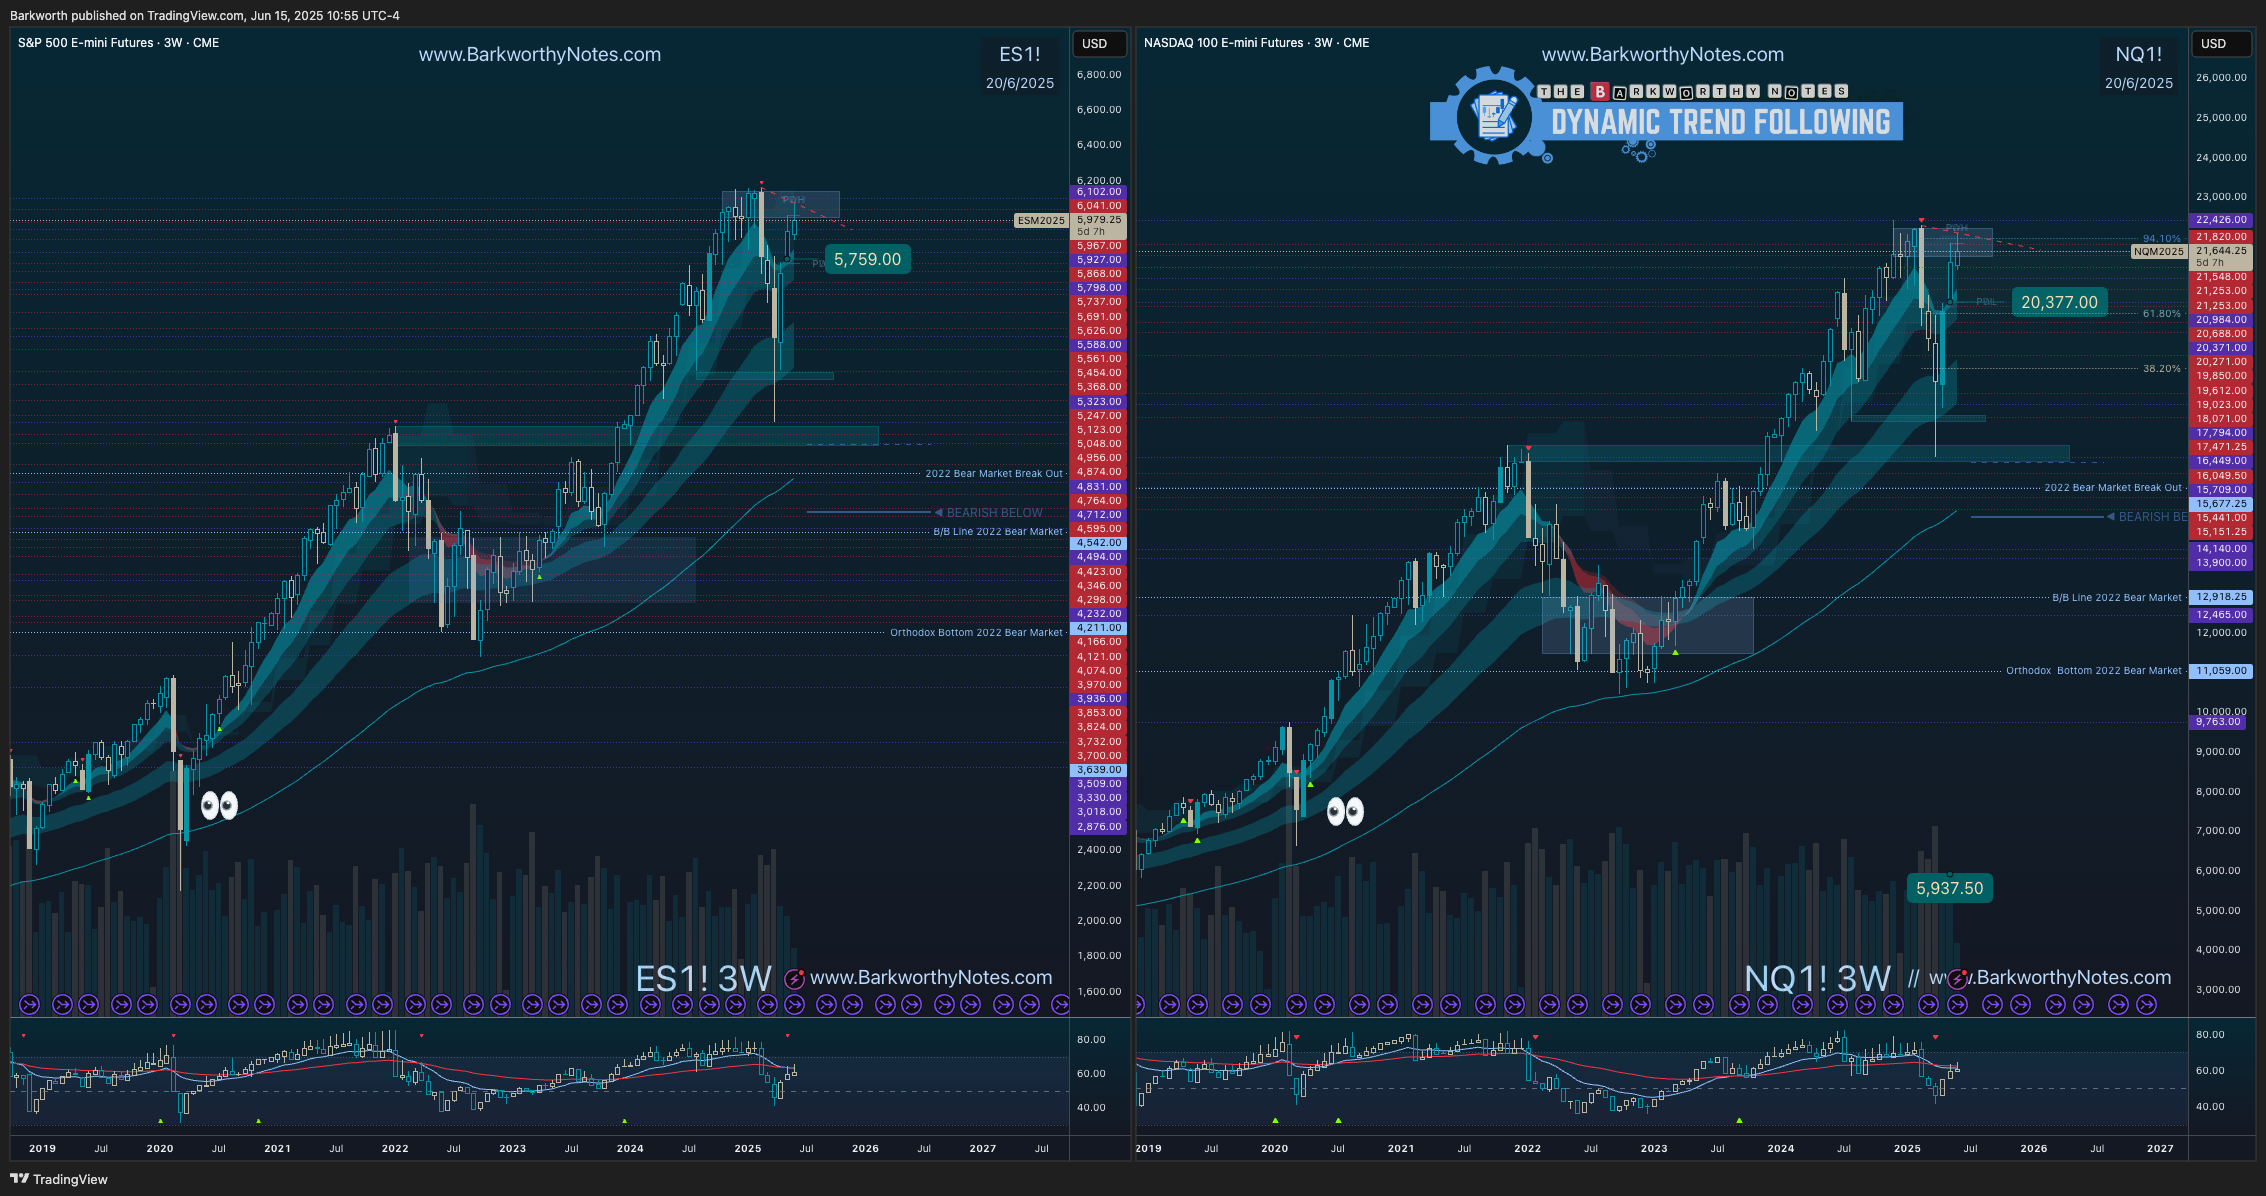
W3 Chart Update
Can zoom out a little bit while there is little to do on W3. Let price history remind us that we don’t know anything about what is next. Markets could crash, but similar aggressive flushes didn’t follow through.
Buyers can afford higher lows above $ES_F $5759 and $NQ_F $20377 without jeopardising the structural uptrend

For the Coming Session
The below chart speaks for itself H4 is leading the daily turn as price is range bounce sideways and testing support. H1 is neutral, but bearish below H1 EMA9.
See trade plan charts and video for details, levels and instruction.