

Key Levels and Failed Breakdowns
And an example of how to use key levels with lower timeframe setups

People often ask me how I achieved the level of precision that I have. After all, the trade plans work every single time. My answer is always “patience” and “execution”, but the creation of trading plans is a simple matter of contractions versus expansion. If you are able to zoom out and identify price discovery (chop/contraction) and distinguish that from trend (displacement/expansion), then all you have to do is isolate resistance and support, then use lower timeframe entry models when price attempts to break through one of those levels.
In other words, levels are key. But not all of them matter on equal terms. Allow me to explain. We will start with a simple hourly contraction range along a strong 4 hourly uptrend.
In this instruction:
What is a failed breakdown, and how do we buy it?
We will use the NQ hourly chart for this instruction, but we have to understand that this concept works on all timeframes and for all assets the same way.
We will zoom in to the 10 minute timeframe to look at the entry models.
We will trace price discovery sideways until the hourly range breaks.
First off, here is the NQ hourly chart.
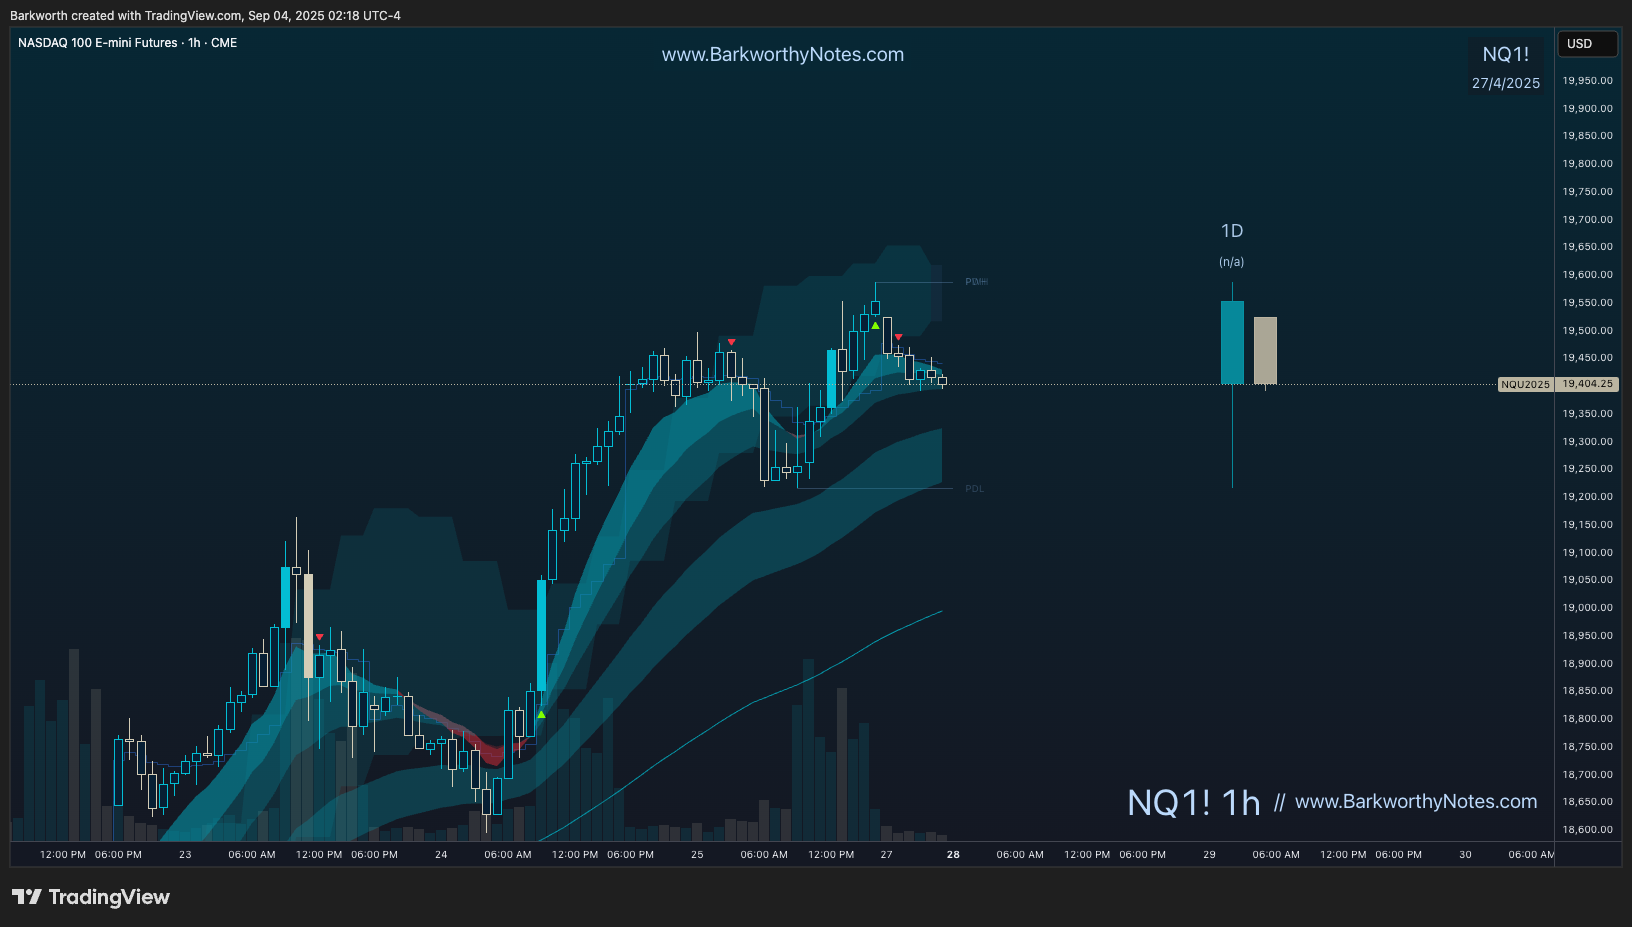
Quick technical analysis:
Price is coming from a strong hourly EMA9 uptrend and is consolidating around the hourly EMA9 while the hourly EMA50 is catching up.
We should be looking for dips into the hourly EMA50 for new longs, but we need some levels to identify supports and resistance.
From the first instructions in the trading course, we know how to find ‘pivots’. Using what we know, we start by isolating pivots first, then line those up to see which ones are dancing around the same levels multiple times.