

M10 Entry Concepts
Framing execution around the Diagonal Entry Model
So far, we have learned how the different timeframes work together, and how we can deduct simple directional probability from the Anchor and Root timeframes. We have also learned how trends and expansion builds on continuation of the underlying trend, and we understand that turns and reversals only initiate after continuation initially fails.
The Diagonal Entry Model is key to continuation versus reversal, with the model setting up the same way across timeframes. When day trading, there are a few combinations of the M2 and M10 timeframes that I consider high probability setups with sniper edges.
In this article, I want to take you through these primary setups from my personal day to day execution concept.
Diagonal Entry Model Execution Concept
During previous instructions we went through a diagram of the basic model. In the diagram below, that model is presented on the left hand side. Execution starts when the model produces a directional break and through.
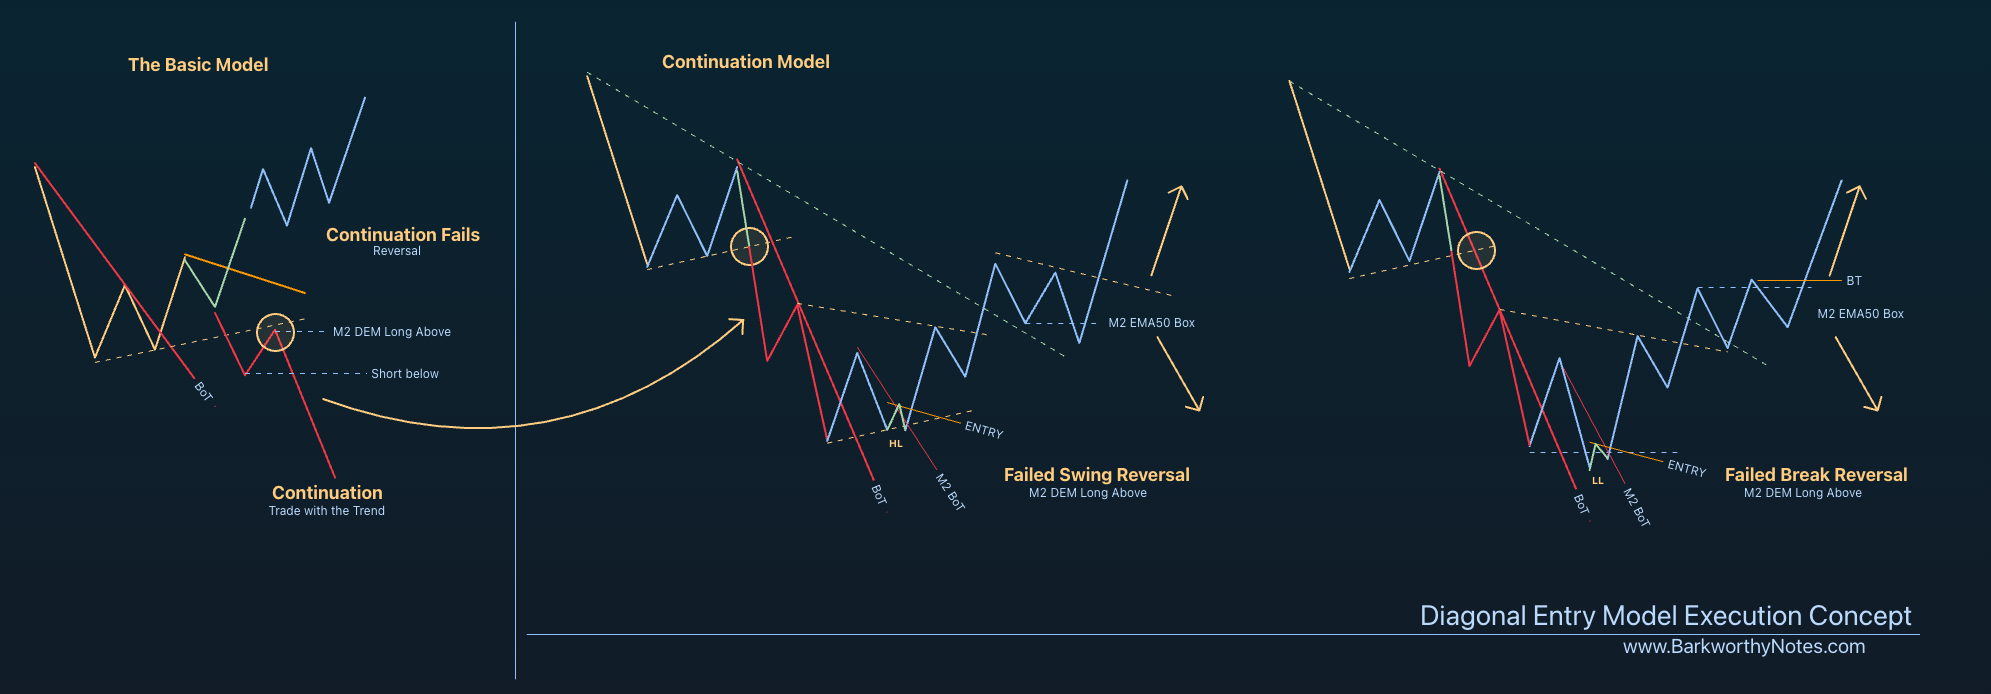
Location is everything, and even though the model works the same in downtrends and uptrends, I prefer to call the uptrend model the Break Out Model versus the continuation model in downtrends. The reason is simple: you can swing long, but you can’t swing short. A short is always a pullback in a higher timeframe uptrend. Even bear markets are pullbacks and eventually find a bottom to push to new highs.
For my execution, I embrace that the trend is always up. When we have hourly selloffs, we can make good money while participating in short trades, but ultimately, price always finds a bottom and then squeezes right back up. In this progression, I use the M10 Continuation Model to participate short until continuation fails and sets up the initial reversal that, if it follows through, could mark a multi week low, or even a low that is never revisited.
Therefore:
M10 Continuation Model to participate in hourly downtrends;
M10 Diagonal Reversal Model;
M10 EMA9 Break Out Model for hourly buy signals;
M10 EMA9 Push to add into trending market;
M10 Base to scalp hourly consolidation or contraction.
Each of these setups could be considered an M10 ‘spotter’ that tells the M2 ‘sniper’ when to pull the trigger.
The Models
We’ve been over the technical details of the basic model, so for this instruction we’ll just use charts to illustrate the setups and highlight the sniper opps.
M10 Continuation Model
This setup is an extremely powerful directional tool. It is essentially a continuation model for existing trends that allows us to measure failed continuation versus breakdown confirmation.
The ‘short’ side of the Diagonal Entry Model was discovered by my friend Zensi, who was using this edge to participate in downtrends while I really only saw the setup’s potential as a reversal model. In celebration of his success, the setup soon earned the nickname ZP or “Zensi Party”, and it was this creativity that allowed us to see the dual substance of the Diagonal Entry Model, where we can use it to measure failed continuation to set up the reversal from the bottom of the setup instead of just the entry diagonal into the top of the setup.
Application:
Hourly downtrends, to play short until continuation fails and catch the earliest stage of the reversal.
Criteria:
M10 lower high and higher low to draw the setup.
Execution:
Defines risk for participation in trend initiation or continuation;
Failed breaks or failed continuation from this model initiate powerful reversals.
Video Instruction
The Diagonal Entry Model has two sides and we depend on failed continuation for reversal context, and as such, it only really sets up one single way every time, and then in two different variations. The same M2 Entry Model can but projected and recognised on M5, M10, H1 etc. and it always looks and works the same way. The magic happens when you see M10 setting up and then understand how to take the sniper entry on M2.
Because of the complexity of explaining this with static charts, I decided to do a video that shows and explains it.
