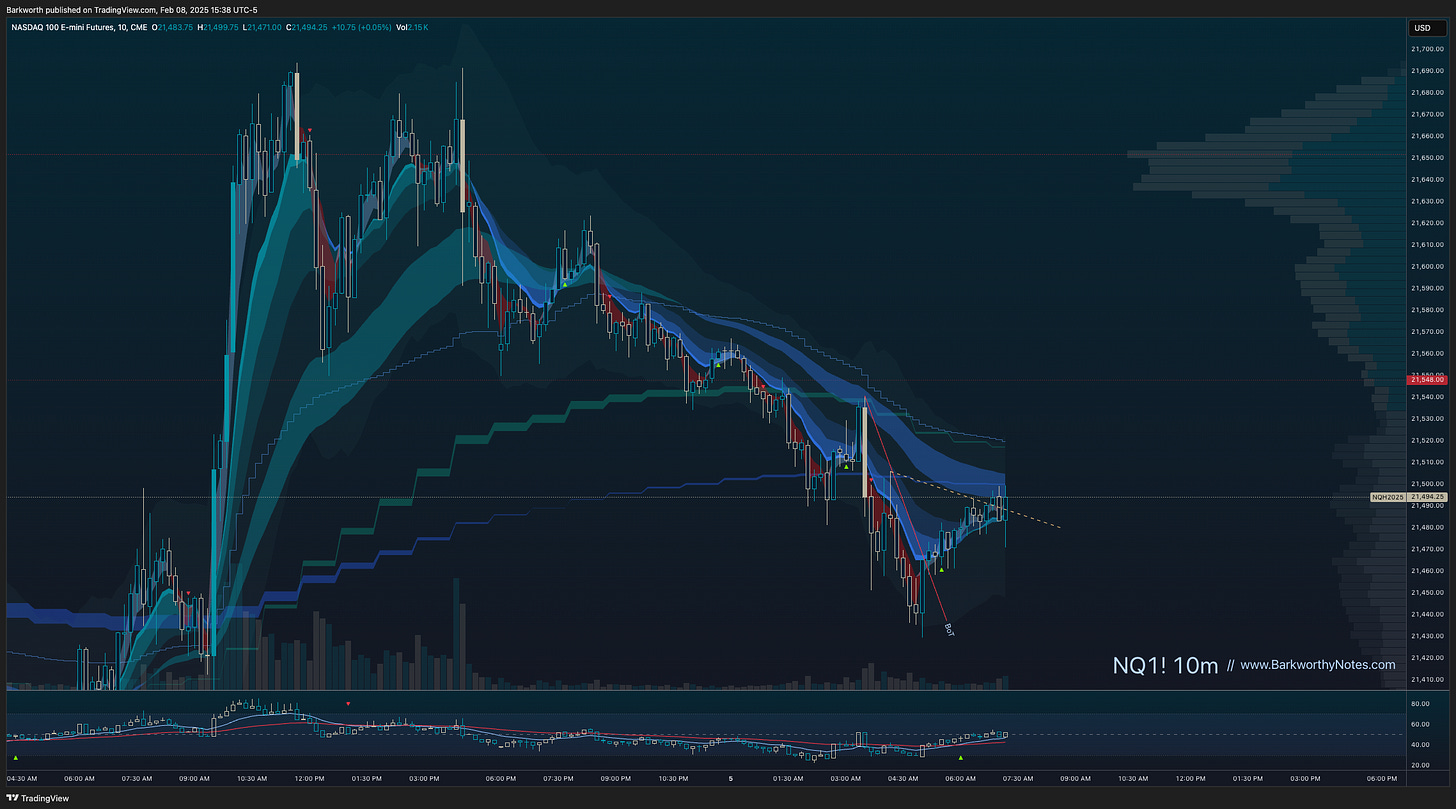
This instruction will hand you a few tools that enable you to look at an ending trend structure and analyse which areas are likely to reject price, and also areas where price is likely to accelerate.
We’ll use this structure for the tutorial, as this has everything we need know, all in a single chart.
You might find yourself looking at a setup like this and assess that price is about to reclaim H1 EMA50, but below H1 EMA21, with a strong bearish control bar just above it. On first sight, this might look bearish, but if we analyse the setup, our models are leading the way.
If the M10 EMA9 Break Out Model triggers, we have to trade, that is the job. So how can we break down the structure into information clusters? It is much simpler than you may expect. I really use only three concepts to lead the way.


