Barky's EMA Boxes
Using imbalances as a directional road map.
This instruction introduces failed swings as future support and resistance levels when trend continuation fails. The pillar for this concept is the exhaustion candle as demonstrated in the How to Identify Key Levels tutorial.
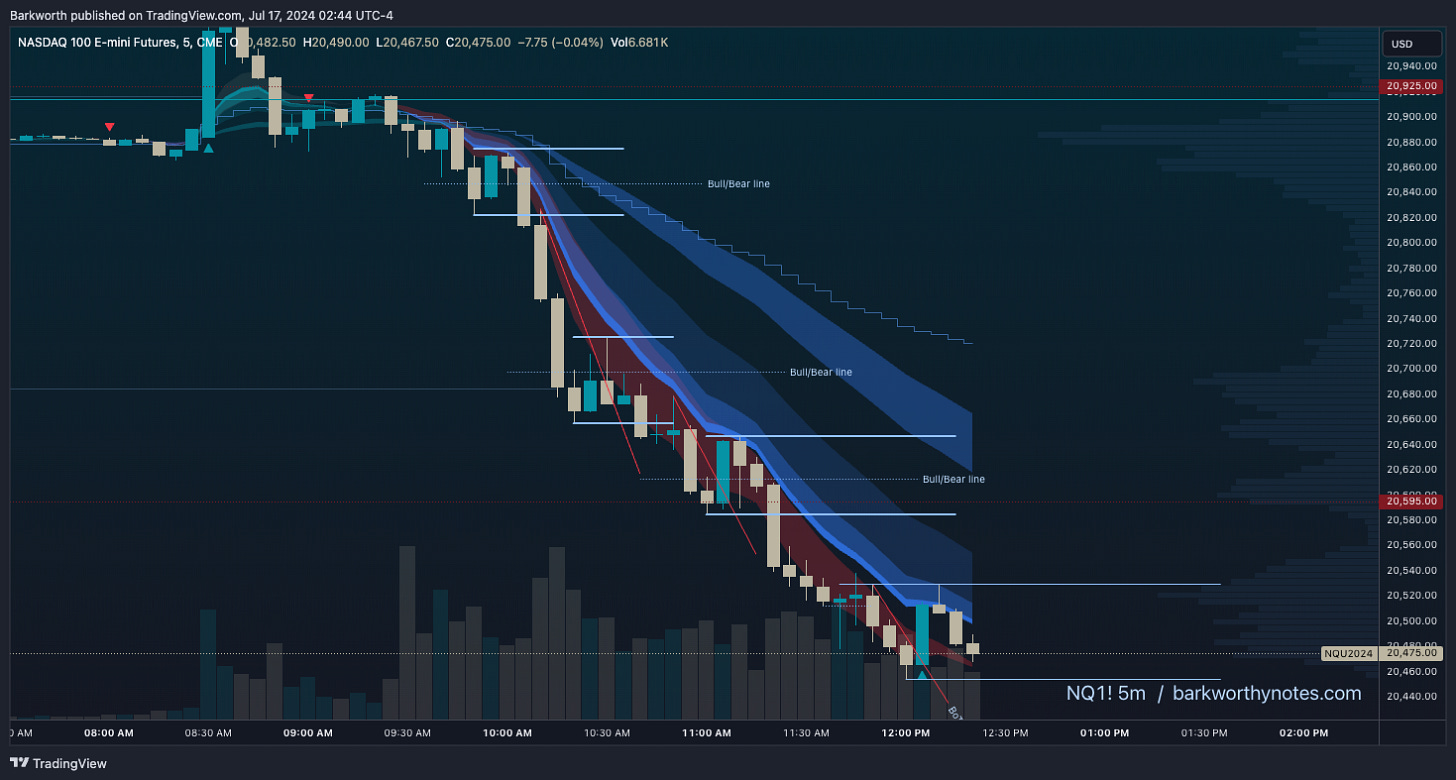
You have read that, and you remember this chart:
These ranges are everywhere, and you can draw one where ever there are candles that closed in opposite directions.
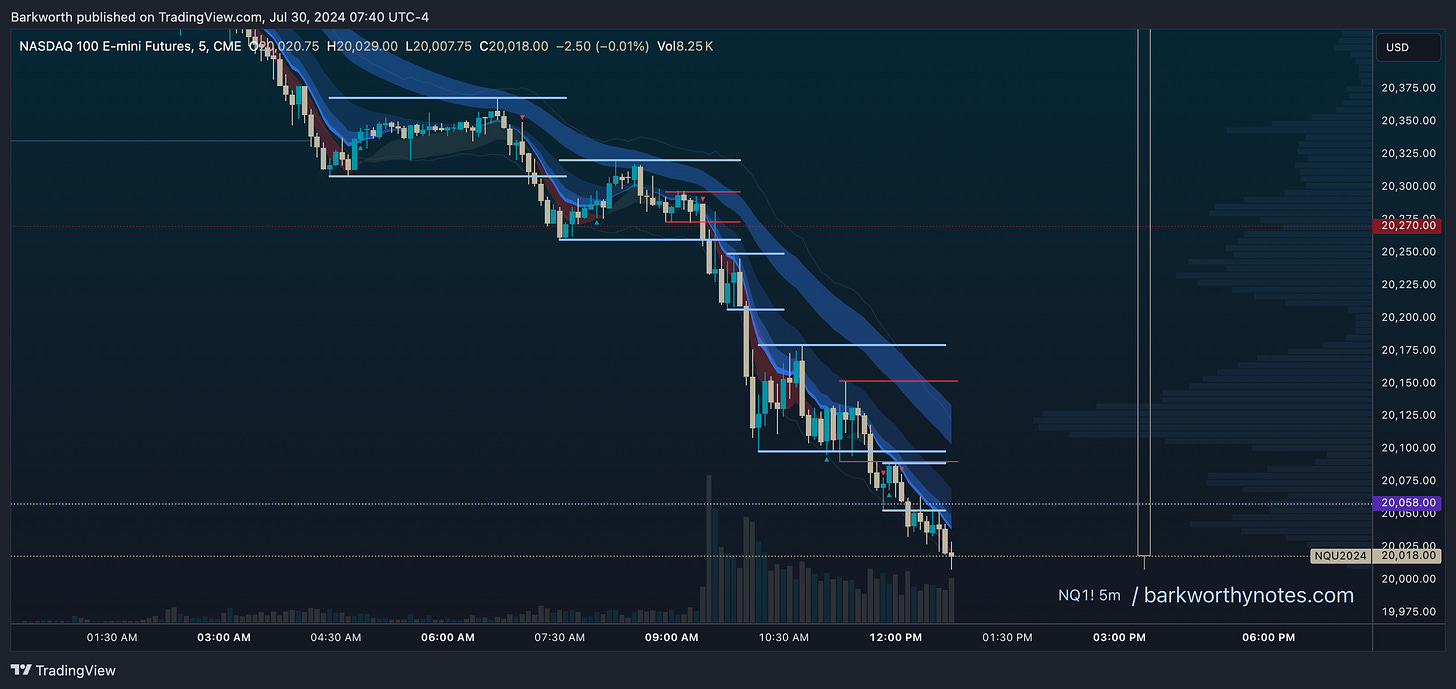
Like this:
All these ranges are the same. They represent pauses in trend, before continuation. All of these are failed swings against the downtrend, even the smaller ones.
They are failed swings, because they are imbalances that failed to form trends - higher highs and higher lows - against the trend. Once a swing against a trend follows through, we’d have a Diagonal Entry Model, and price would be attempting a reversal.
All swings in the direction of the governing trend followed through, none of them failed.


