

The Anchor and Root Timeframes
The decisive link between lower timeframe entry models and hourly swings

So far, we have looked at the Diagonal Entry Model on lower timeframes as an EMA9 Continuation or EMA9 Reversal model and explored how we use the EMA9/EMA50 relationship across timeframes to inform us.
The Diagonal Entry Model allows us to buy/sell EMA9 break outs/downs, and it allows us to buy/sell EMA9 reversals when continuation of an existing EMA9 trend fails.
When you have practised the lower timeframe setups enough times, it becomes easy, while your commitment to a single methodology starts to give you feedback and reference points. You will understand that certain setups, certain configurations, you have seen before. Some of them you know can’t be trusted, while others will give you extra conviction. You will feel that you are ready to move away from just scalping, but you need an extra tool for that.
The next step in your education will allow you to make this leap. The first progression comes with the realisation that price is fractals. Models set up in identical ways across timeframes.
From the Definitive Control Model instruction, you remember this illustration:
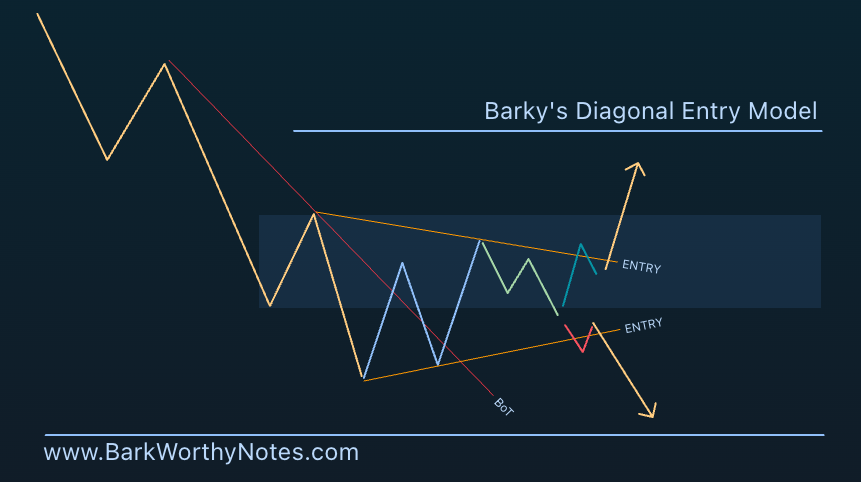
You can zoom out, zoom in, it doesn’t matter what timeframe you pick, you will find this model at EMA9 consolidations on all timeframes. Then, if you zoom in on an hourly EMA9 consolidation, you’ll find M5 or M10 diagonal entry models setting up acceptance or reversals.
And when you zoom in on that M10 Continuation Model, you will often find an M2 sniper entry setting up with again a smaller version of this same concept.

Price is Fractals
Big model, small model, always the same concept. Failed swing or failed break, higher low or undercut, there are really only two ways that price reverses, and in this understanding, we can turn to the hourly timeframe and identify continuation setups along H1 EMA9 trends, and then manage the entries on M15/M10, and often even as low as M2 for ultimate risk/reward and position management.
This is the kind of awareness that allows you to trade intra day swings.
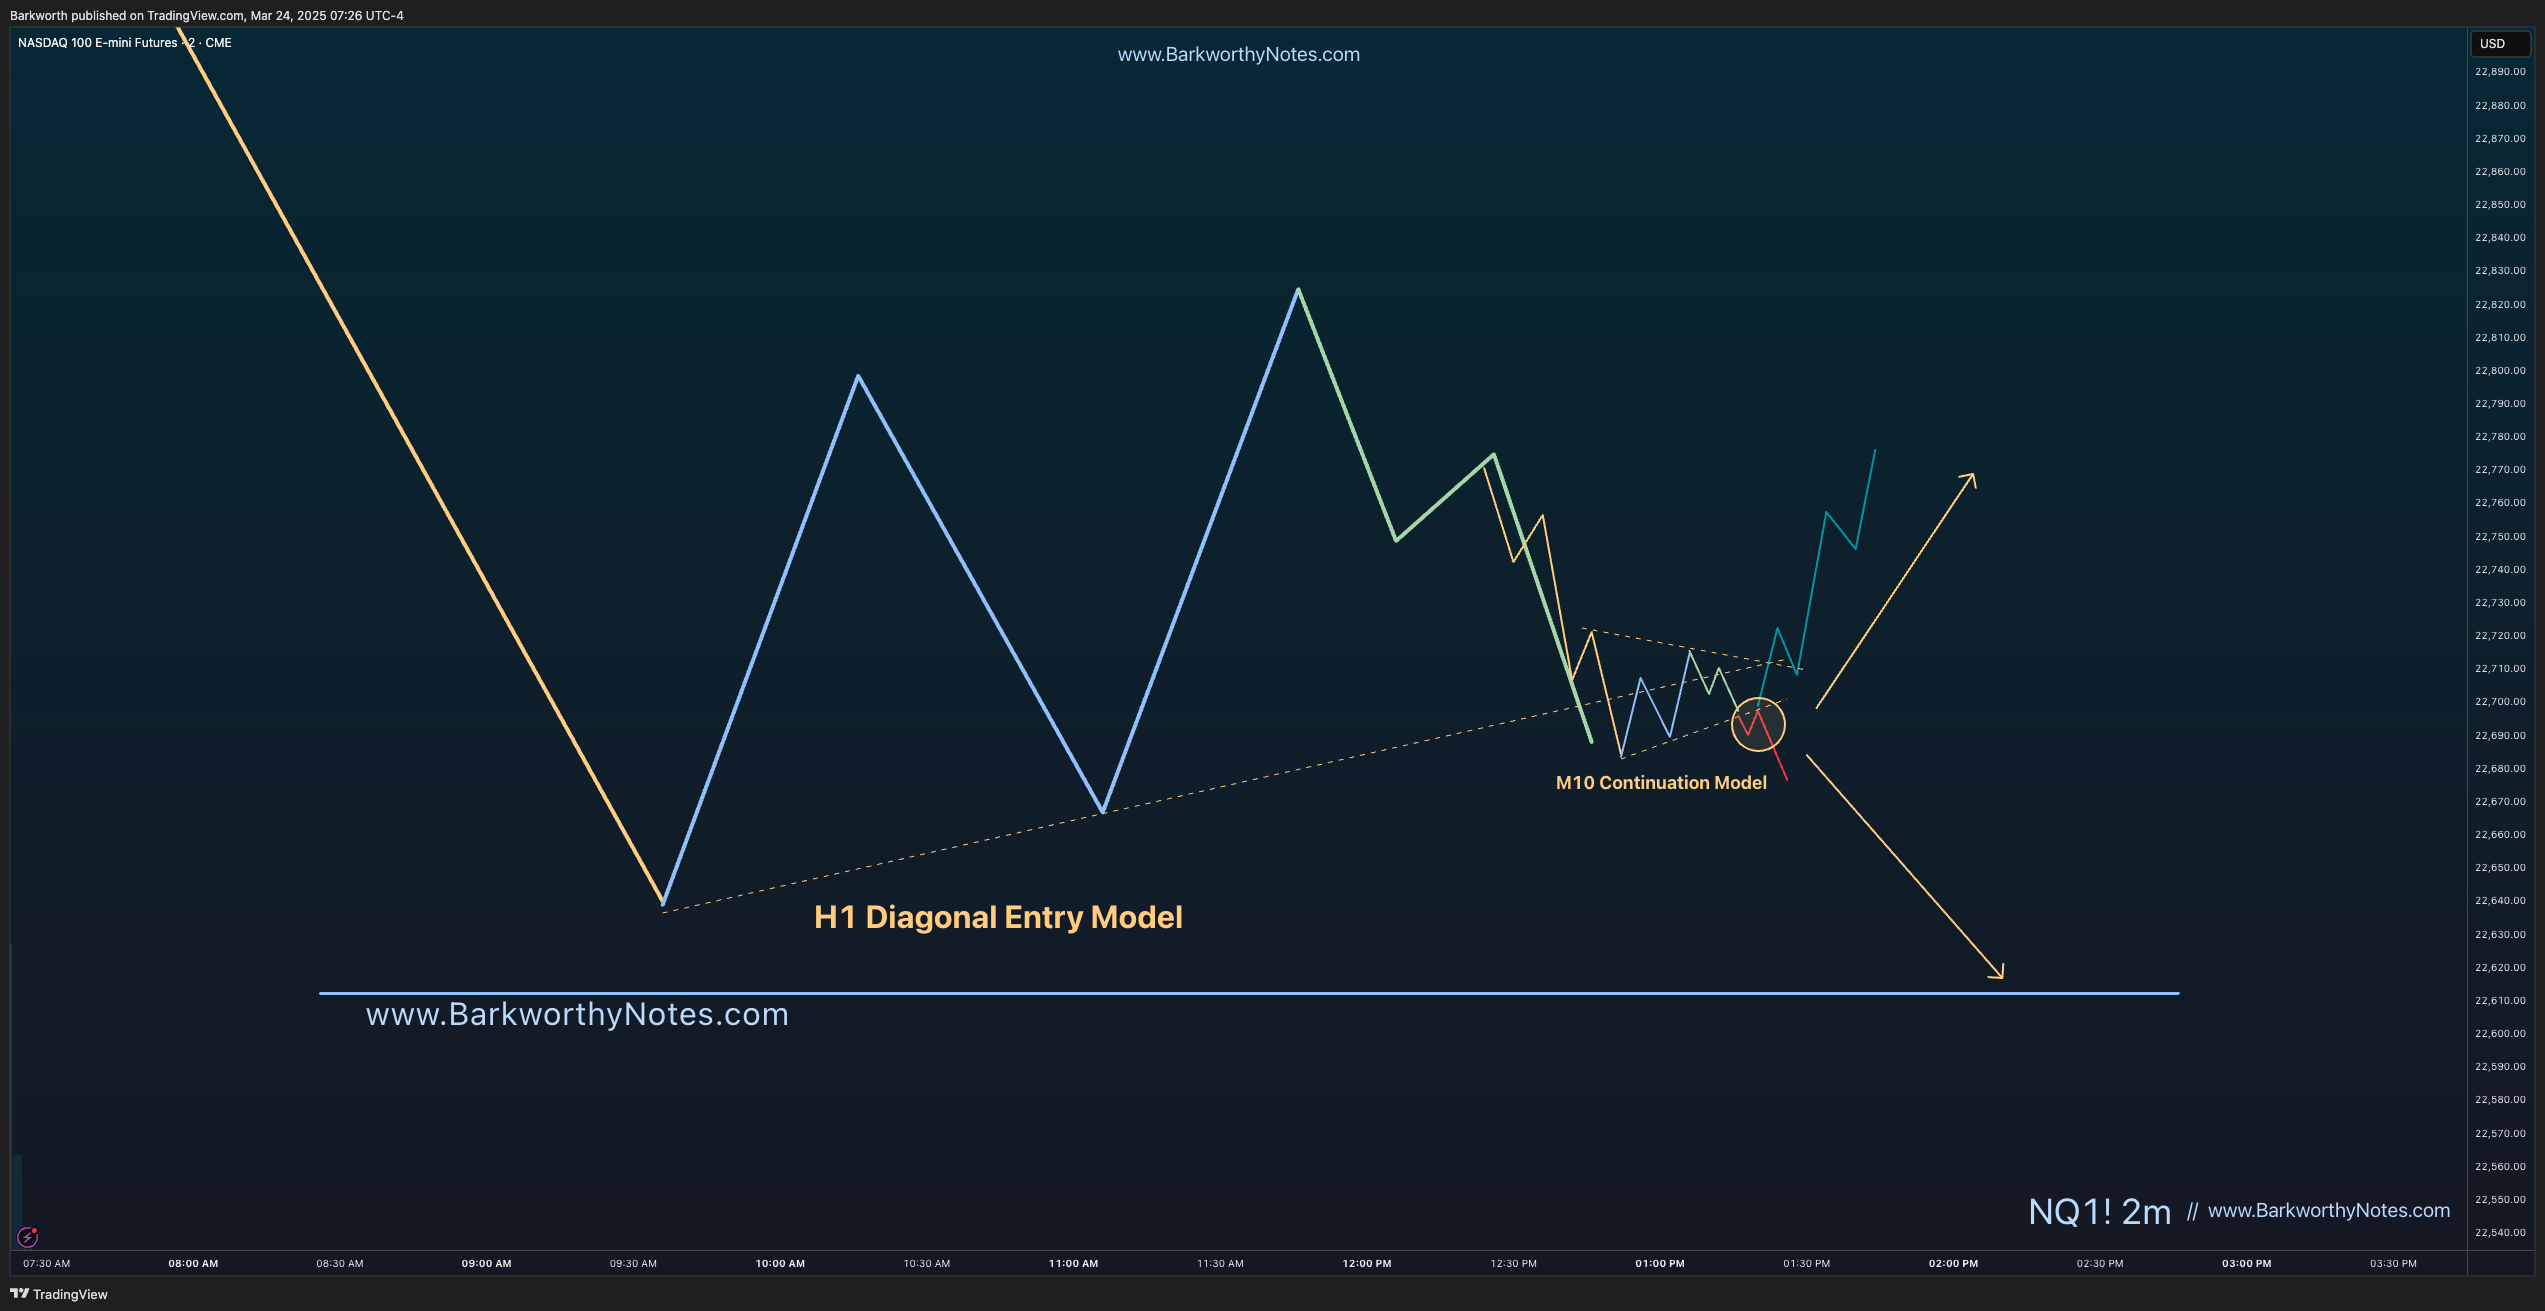
Let’s have a look at a few setups. We now know the models, so we can simply zoom in on hourly charts and see if we recognise our setup.
Here is an hourly chart with seven EMA9 reversals marked.

Here is the same chart on M10, with the entry models drawn in. As you can see, they all comply with the Diagonal Entry Model, the way I have explained it during the first articles of this trading course.
