

Hourly Swings (H1 EMA9 BT Entry)
Using EMA9 Support and Rejection to Define Entries and Risk

In this article:
The Significance of the EMA9 Parameter;
The Hourly as the Guide for Trades “Root Timeframe”;
The H1 EMA9 BT - your first timeframe specific, high probability entry setup.
This instruction will explain the significance of the EMA9 for the Diagonal Entry Model and give you your first high probability entry concept, a framework to specifically look for, using the hourly timeframe.
The Significance of the EMA9
Trend is higher highs and higher lows / lower highs and lower lows. Period. When markets are in stages of expansion, we see these higher highs and higher lows form along a trending EMA9. During times of contraction, we see higher highs and higher lows, but the EMA9 does not continuously interact with price.
Here are two examples of that.
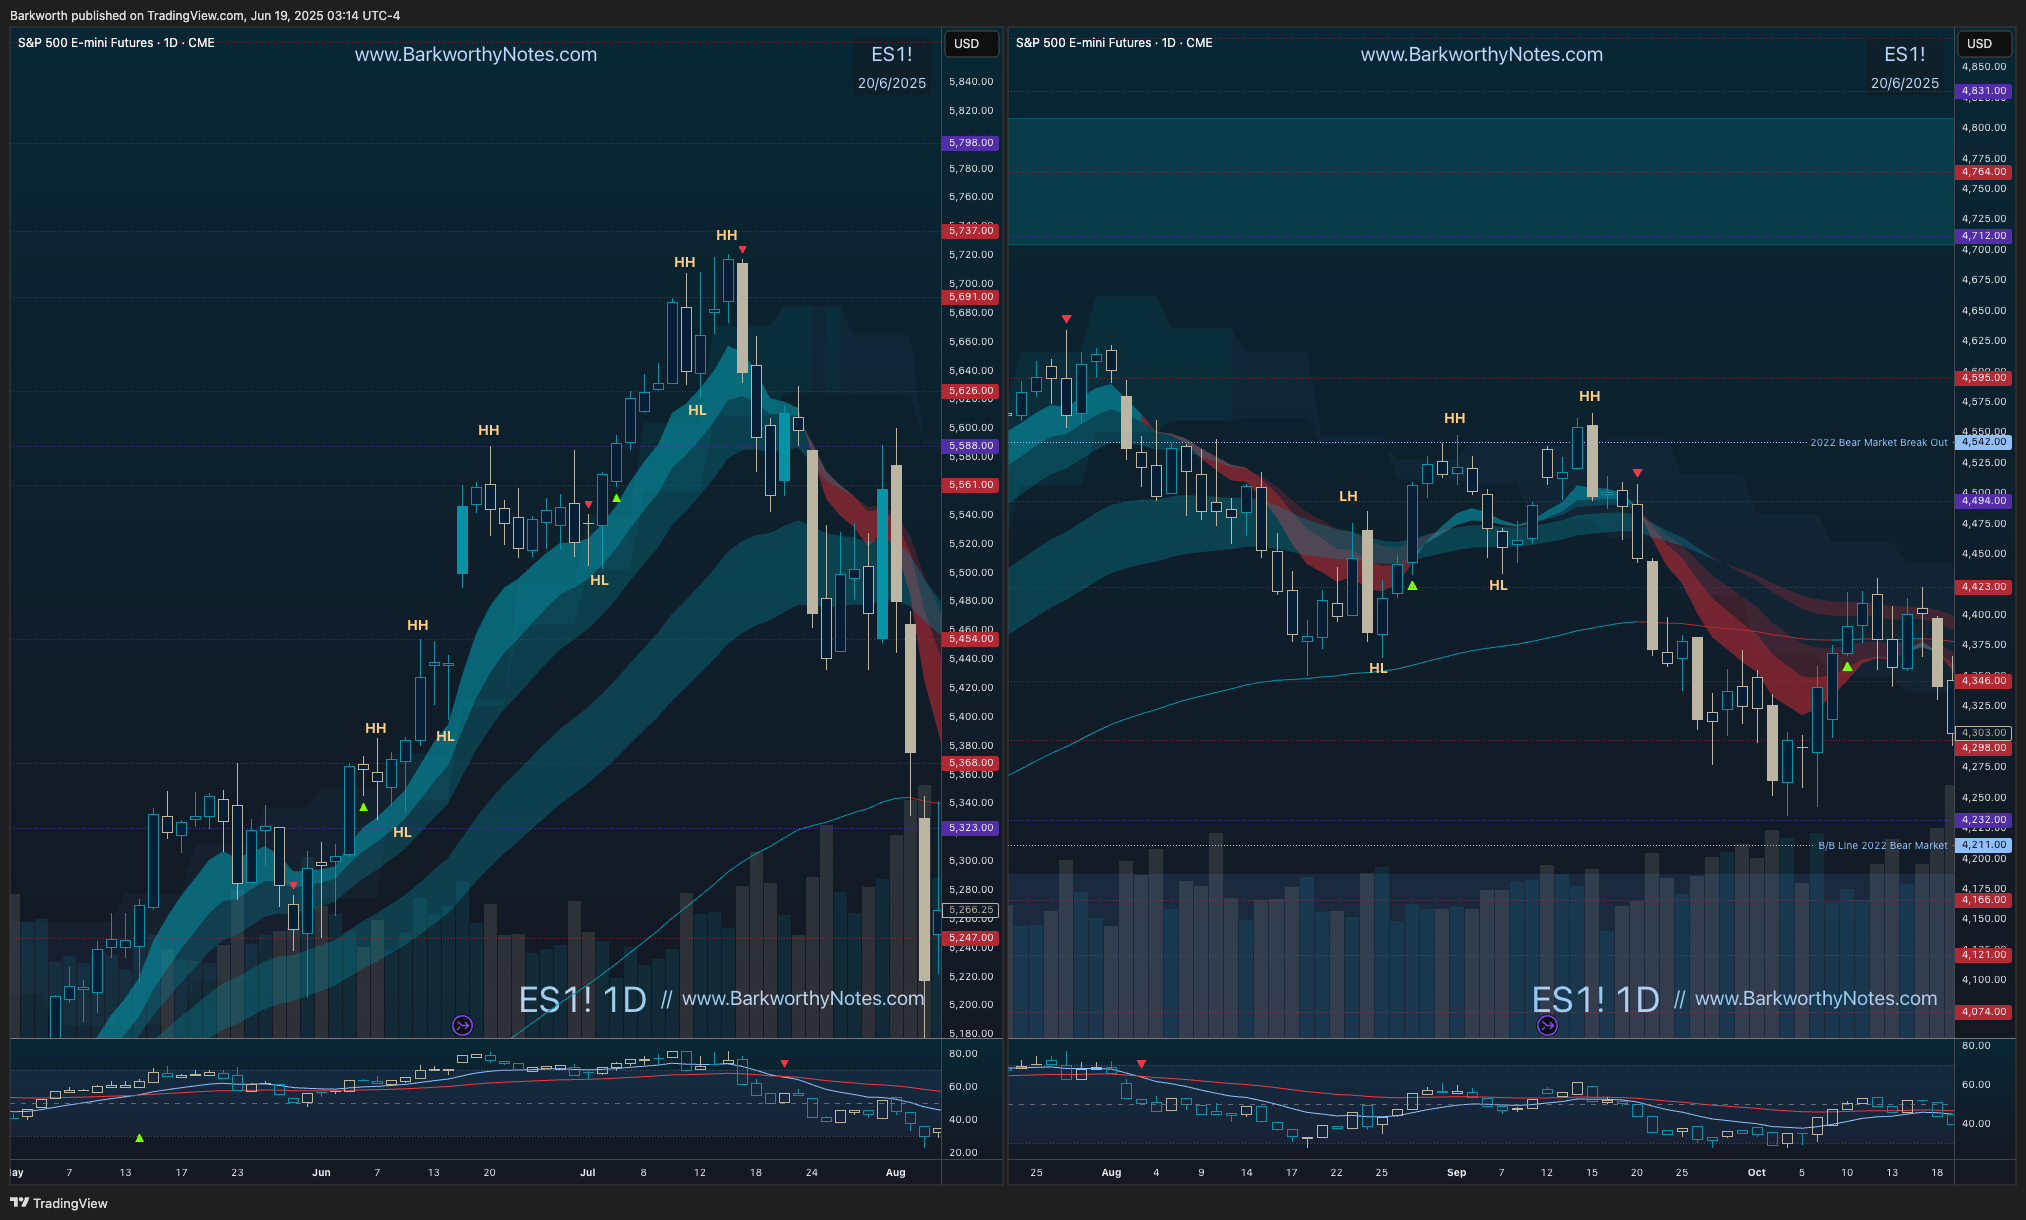
On the left hand side you see price making higher highs and higher lows, with each higher low confirming into the trending EMA9.
On the right hand side you see price making higher highs and higher lows, but the pivots form independently from the EMA9.
The EMA9 Parameter
The reason why this works is simple: everybody has a favourite timeframe to trade, and look at the EMA9 versus the EMA50 on that timeframe. Few understand that an EMA50 on a lower timeframe always mathematically aligns with an EMA9 on a higher timeframe. This understanding forms the basis of Barky’s Dynamic Trend Following system. More about this later. For now, let’s just focus on the EMA9 on a single timeframe.
EMA9 Trend Dynamics
When EMA9 trends end, price always seeks continuation into the EMA21, with EMA50 below. Reversals are only validated after the EMA50 is breached, the EMA9 is retested, and new highs or lows confirm the shift, with the EMA9 guiding the new trend. This reflects a reliable supply-and-demand dynamic, where the EMA9 on the active timeframe pauses, enabling traders on higher timeframes to bolster positions at the EMA9. Like a precise game of ping pong, the EMA9 always leads, without fail, unfolding with near-mechanical consistency every time.
In short, this is how EMA trends work:
When an EMA9 trend ends, price crosses EMA9, holds below it and pulls back to the EMA21;
EMA21 either sets up continuation of the EMA9 trend (the EMA9 reclaims, backtests and price moves higher), or the EMA21 is lost, and then price seeks the EMA50;
EMA50 rejects price for a bounce and from this bounce , we can now look for continuation, reversal, or consolidation.
Living in the EMA9 Trend
Summarising:
Trend is higher highs and higher lows / lower highs and lower lows along EMA9, where buyers or sellers add and exit;
When price rejects at a certain level and seeks the EMA9, it confirms a higher low as the EMA9 produces a bounce for an attempt at continuation of that existing trend;
During break out attempts, price will make a higher high - look above a diagonal or a previous high and come back to test EMA9. When EMA9 supports price, it confirms that the initiating trend is attempting to follow through;
In both cases, when that follow through fails, that EMA9 rejection ultimately becomes the higher low that confirmed that continuation failed, giving context for a trade into the opposite direction - “failed swing” or “failed breakdown”.
Entry Concept: The H1 EMA9 BT
—“The best trades come from backtest entries.”
We had a look at the EMA9 BT as a concept in the instruction on Entry Diagonals, where it is briefly explained and demonstrated. The EMA9 backtest is a powerful method to define risk after price has pulled back into an EMA9 during trends or during break out attempts. Follow through fails if price fails to hold that EMA9 ‘touch’, and we can use the EMA9 - EMA14 zone as a reference that tells us that ‘EMA9 is holding’.
After the EMA9 backtest, continuation or follow through confirms when price makes a new high.
This concept is very consistent and very powerful. It allows us to define the smallest possible risk distance for optimal position size. It would make sense to wait for just those trades that set up risk and confirmation by means of this EMA9 backtest.
Why the Hourly Timeframe?
No timeframe creates a better filter between lower timeframe setups (day trades) and higher timeframe setups (swing trades) than the hourly (H1). This is also the reason given for Barky’s Three Level Trade plans, which uses hourly levels to define contextual bias.
If you want to do more than just scalp 2 minute or 5 minute reversals, the hourly timeframe is your best bet. Undercuts of hourly levels give context for failed breakdowns that seek the hourly EMA9 for solid risk/reward, and once price reclaims the hourly EMA9, all timeframes below are above their EMA50’s. This means that M1, M2, M5 and M10 are all trending at this point.
We are at the beginner stage of this trading course, however, and more details on the hourly timeframe as a roadmap for trades can be found under the Day Trading section of the course, where we introduce it at the Root Timeframe. If this is your first read, then stay tuned, because you are about to discover the highest probability trade setup that Barky’s Dynamic Trend Following has to offer. It is the H1 EMA9 BT, explained here in three simple steps.
H1 EMA9 BT Entry Concept
The H1 EMA9 BT is a real concept, because by the time this setups up, M10, M5, M2 and M1 are all of them above their EMA50 and either trending or attempting to trend.
The setup forms in three simple steps, which are outlined below below. The Discord offers Full Members an additional video instruction and backtest video that takes you through the parameters and several examples.
Let’s get to it!
First We Need a Setup
No setup, no trade. As explained earlier, the EMA9 BT can only have merit when price has looked above something. In the example chart below, price is setting up hourly Diagonal Entry Models and broke the ECD.