There are many ways to draw a DTL, but there is only one method that allows you to use it to read trend. I have mentioned to followers before that the algo diagonals, the ones that I draw and use - as explained and detailed in the Diagonal Entry Model instruction - are representatives of the EMA9 on the timeframe you’re charting.
Therefore, interaction with the EMA9 on that timeframe should be a parameter for drawing the DTL correctly.
Trend Dynamics
The only real principle of a trend, is higher high, higher low, or lower high, lower low. Nothing else is relevant. Traders use moving averages to add and exit, and simply because of that, moving averages serve to confirm trend. But trend exists without moving averages. The moving averages don’t make the trend, they lag it, and confirm it.
Price moves in fractals. Higher timeframe advances consist of endless combinations of lower timeframe fractals. Trend is fluid like this. A single higher timeframe trend consist of many lower timeframe uptrend and downtrends, and the leading timeframe of each trend simply shifts back and forth between lower and higher timeframes.
Dynamic, like a game of tag.
The parameters for my signature Dynamic Trend Following (DTF) system are designed around this understanding.
EMA9 Parameter
A solid parameter to identify the leading timeframe is the EMA8/9, whereas the EMA50 represents the EMA9 on a higher timeframe. This is simple mathematics, and the basis of my Dynamic Trend Following system.
A reversal attempt is always initiated by the EMA9 failing to reject/support price. But if this reversal manifests as a mean reversal or a trend reversal is yet for price to prove.
Reversals start on the lowest timeframes, and then slowly spread to the higher timeframes, ending the EMA9 trend on each of them, one at a time. Sometimes very direct (V Shape), other times very volatile (Balance Zone).
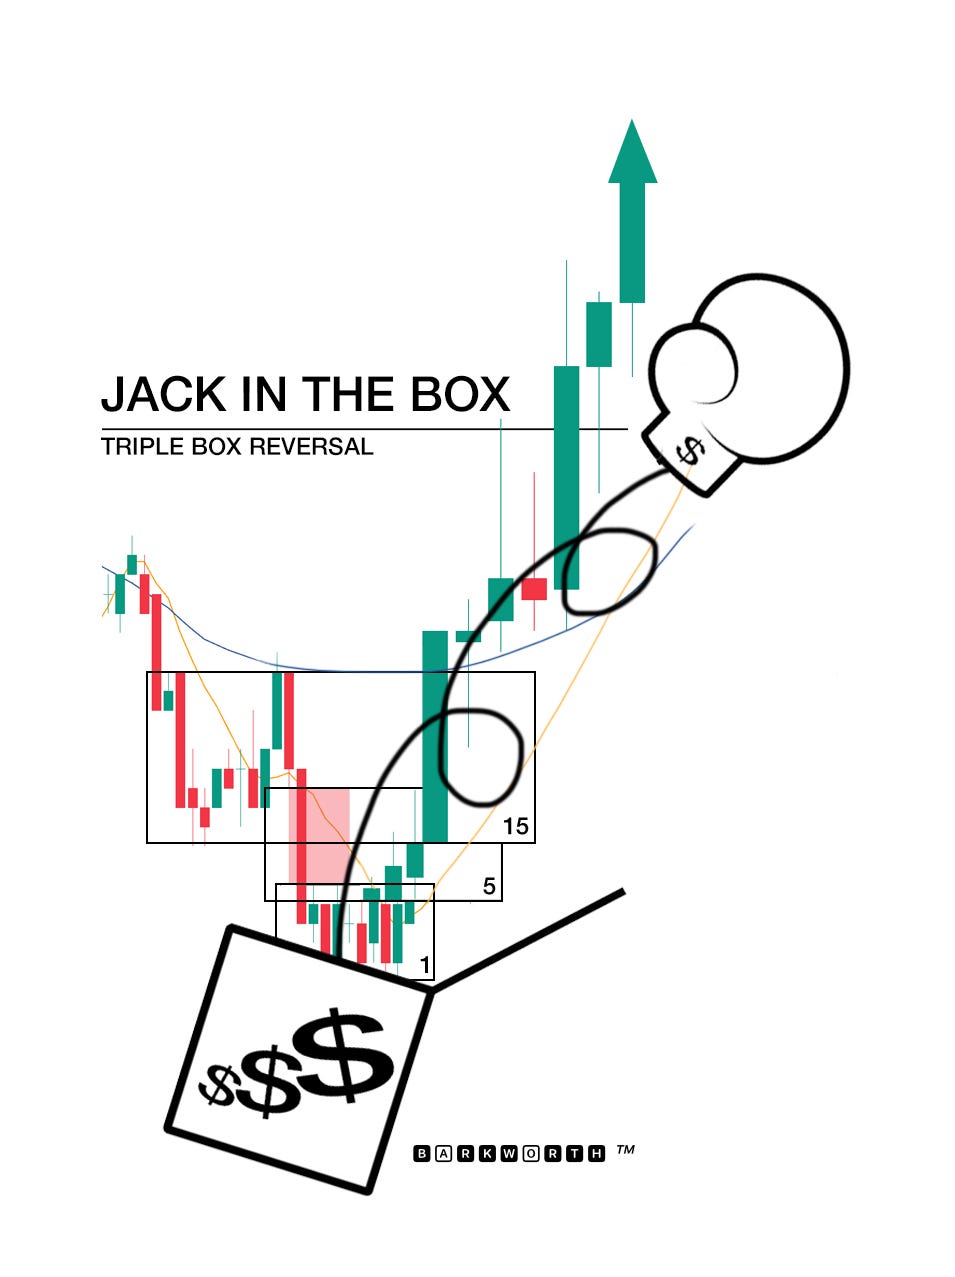
For this instruction I want to use a balance zone, because it offers the best opportunity to demonstrate the dynamics that form the basis of my system. When you analyse a reversal out of a range bound consolidation, a “box” or a “rectangular consolidation”, you’ll see that a 15 minute balance zone produces a multitude of 1 minute trends in both directions, until price breaks out of this balance zone. When you analyse break outs out of balance zones, you’ll see that the earliest entry was given on the 1 minute chart, then the 3 minute chart confirmed, 5 minute triggered and then finally pushed through the 15 minute break out level. This is a chain reaction, a series of edges and buy signals that trigger all in sequence.
When I first discovered this repeatable concept, I called it the Jack in the Box setup.
I was so euphoric about this insight that I celebrated it with a meme. I want to share this here, in part because then I’ll stumble upon it from time to time, and it reminds me of those early days, but for you, if you look at the candle stick setups, you’ll see that the meme is not fictional. Price consolidated below and M15 bounce, and when that M5 consolidation broke higher, price reclaimed the M15 zone and exploded through it. That is the core of the Diagonal Entry Model, and this instruction will explain how PATIENCE gets you there.
If you look at the details, you see a 1 minute range, a 5 minute range and a 15 minute range break out in sequence as price accelerates with each buy signal that triggers.
Leading Timeframe
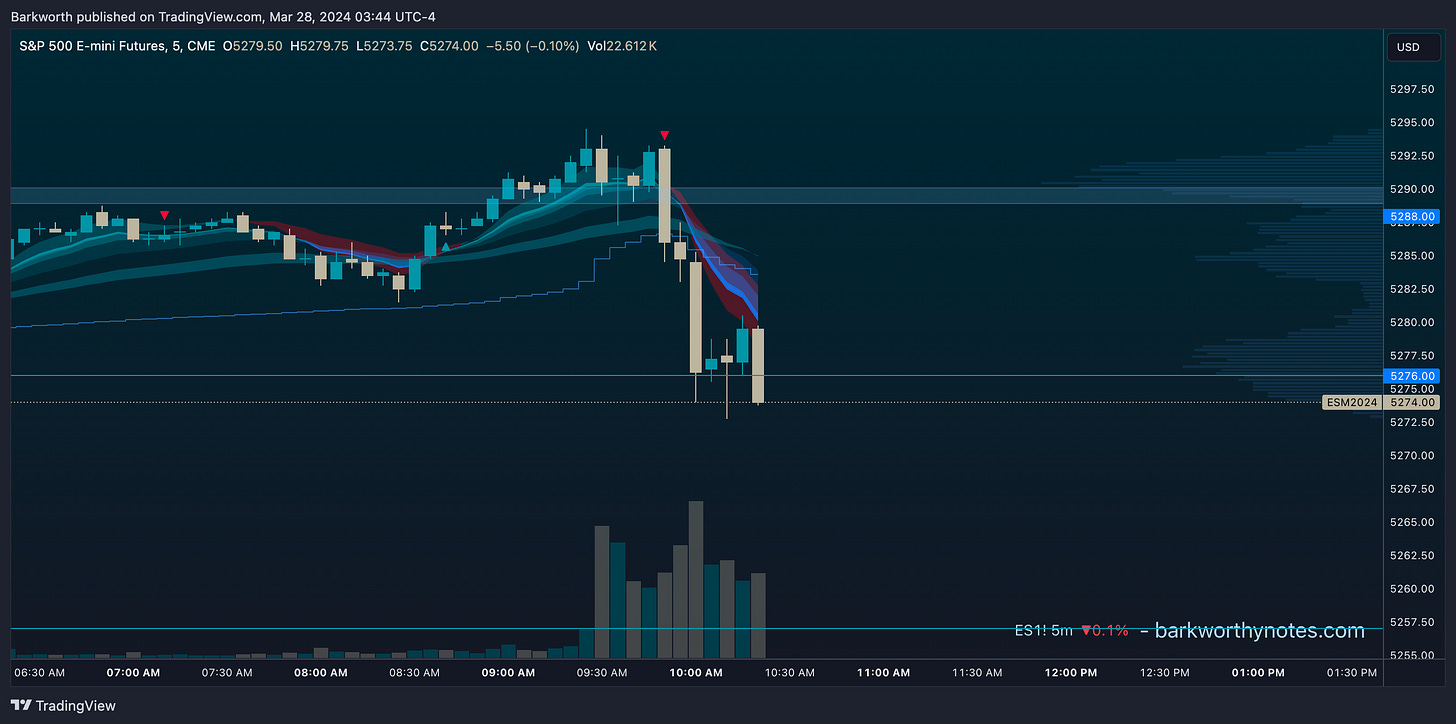
If you want to play for a reversal or a break down, the first thing to do, is to identify the leading timeframe. From the M15 chart below, you clearly see that the EMA9 was rejecting price at each touch. This confirms that sellers are using this particular EMA to add to their positions.
After a steep sell off, there is initial volatility that triggers many FOMO players to ‘buy the dip’. This is a mistake. We have to wait for price to start a consolidation, no matter where, while the EMA clouds catch up. If the lower timeframes fail to push lower, price will stay locked inside the range until a higher timeframe EMA catches up, or break higher to test these higher timeframe EMA’s into resistance.
Therefore, when you initially have a sell off, there is nothing to trade against. Price is attempting a downtrend (it made a lower low) and if we want to see a reversal initiate an incentive to buy the dip on a risk informed basis, we need a lower high to trade against.
When that lower high forms, we can zoom in to different timeframes and locate the exact timeframe that produces an EMA9 push. In this case, it was M5.
If you look at M3, you see that the EMA9 did not reject price. You can backtest this, and confirm that sometimes M3 is leading, other times M5 is leading, and this phenomenon works on all timeframes the same. The EMA9 push tells you where the most sellers are concentrated. The leading timeframe.
The leading timeframe has to initiate the reversal. Here is how that works:


