

The Framework
A Basic Guide and System Introduction


Every chart is fundamentally geometric. Every print is a buyer meeting a seller, recorded as value and time. Value moves the plot up and down; time drags it sideways. Supply, demand and the passage of time. Geometry is the foundation beneath Fibonacci levels, MACD, RSI, Elliott Waves, standard deviation, Gann, Wyckoff and the like. The purpose of all this logic is control. All of them measure the exact same underlying foundation: trend structure.
- - -
Introduction
Four ideas carry the whole system. This article introduces them one by one.
Trend structure is the directional driver. Price moves in a repeatable sequence of pivots — higher lows in an uptrend, lower highs in a downtrend. Structure tells you direction. Nothing else does.
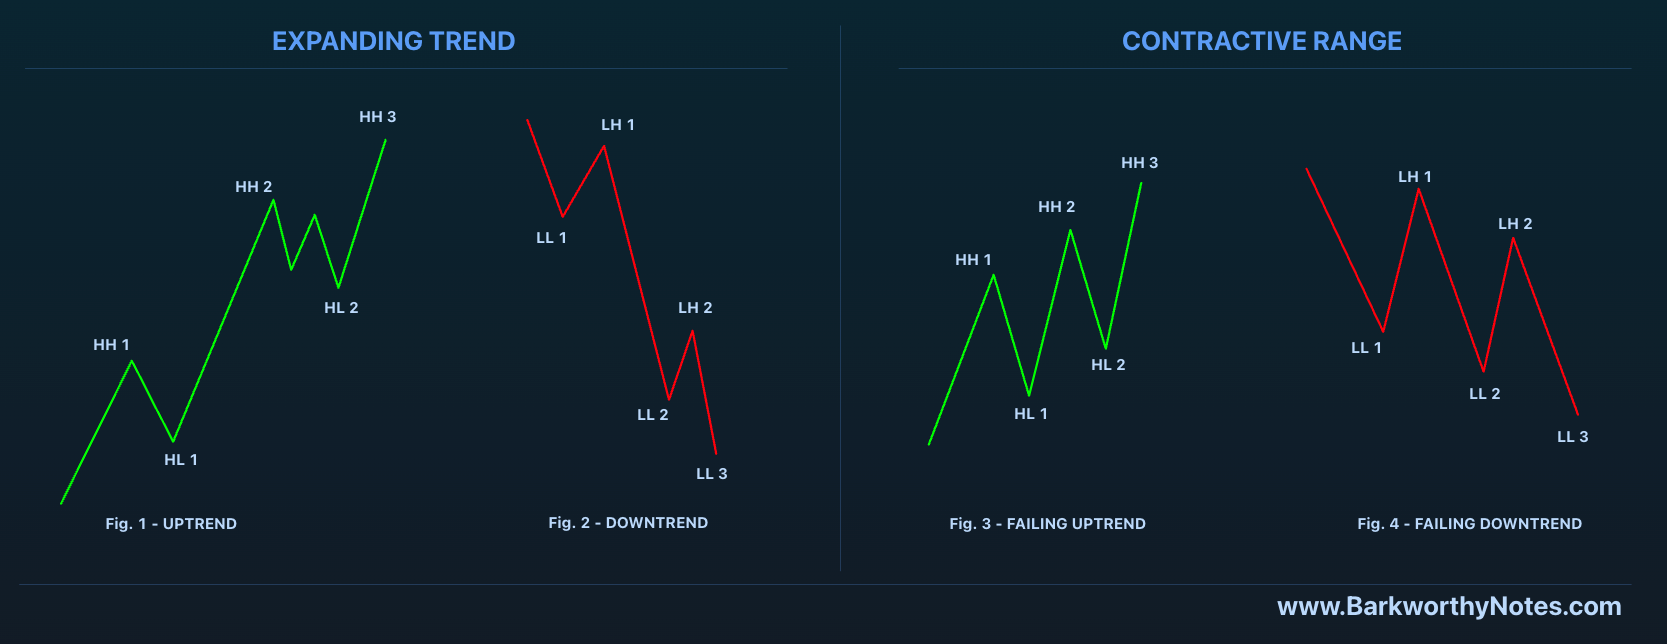
Whether price is trending (expanding to new levels higher or lower) or contracting (forming a sideways range), trend structure is always the same: three advances and two pullbacks in uptrends, three declines and two bounces in downtrends.
The key parameter for Dynamic Trend Following is that second rejection — the second higher low in an uptrend, the second lower high in a downtrend. For the sake of clarity, this article will continue to focus on bullish setups only. That means dip buying, reversals and failed breakdowns. The logic is identical, but inverse at the end of uptrends.
- - -
Markets are supply and demand. Price contracts while one side absorbs the other, then expands when it resolves — a breakout into an uptrend, a breakdown into a downtrend. Every expansion starts from a contraction.
Contractions give us two opportunities: emerging trends (balance breaks) and bear traps (balance holds).
Upgrade to paid to unlock this video
EMA clouds gauge momentum. The 9/14/21 EMA cloud is a visual aid. It shows how strong a move is and where price is likely to react. When strong trends end, the turns always have the same mechanic. Price tests the EMA9, rejects, then comes back to test the EMA14, rejects a second time before EMA21 is tested. These rejections can be mild or aggressive, and must be anticipated when considering trade management.
The EMA21 is the mean — mean reversal. Buying a breakout into an untested EMA21 is risky. You want the higher low into the EMA9 to confirm buyers are in control.
Add Barky’s EMA Clouds indicator to you chart — find the latest version on the website’s indicator page.
Upgrade to paid to unlock this example chart.
The Turn is the Setup. When trend structure is combined with the EMA clouds, the two lower highs that form the basic reversal setup align perfectly with the turn of the clouds — LH1 on the EMA9 rejection, LH2 on the EMA14.
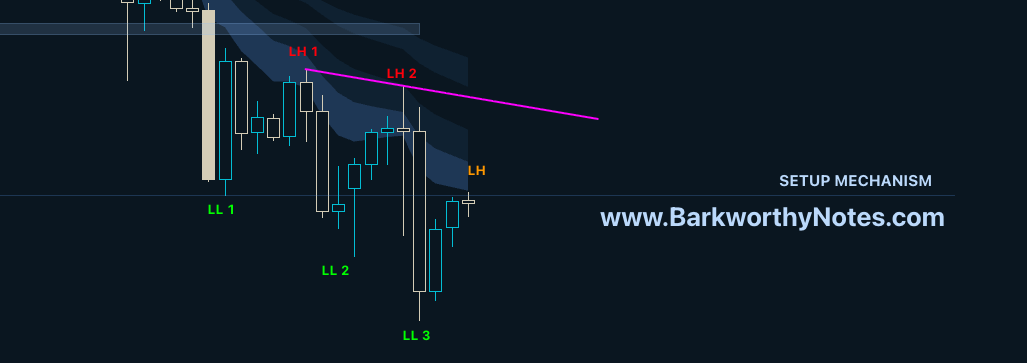
Buying a breakout through that upper wedge diagonal would confirm the low and initiate the search for a lower high, but the risk of immediate rejection is real. Price would maintain balance. Breakouts are trend continuation. Higher lows are trend confirmation.
In other words, when trend structure completes, a bounce initiates a trend structure into the opposite direction. A higher low is then needed to confirm the emerging trend before we can take a risk and attempt to participate. That higher low is the confirmation that we want to buy.
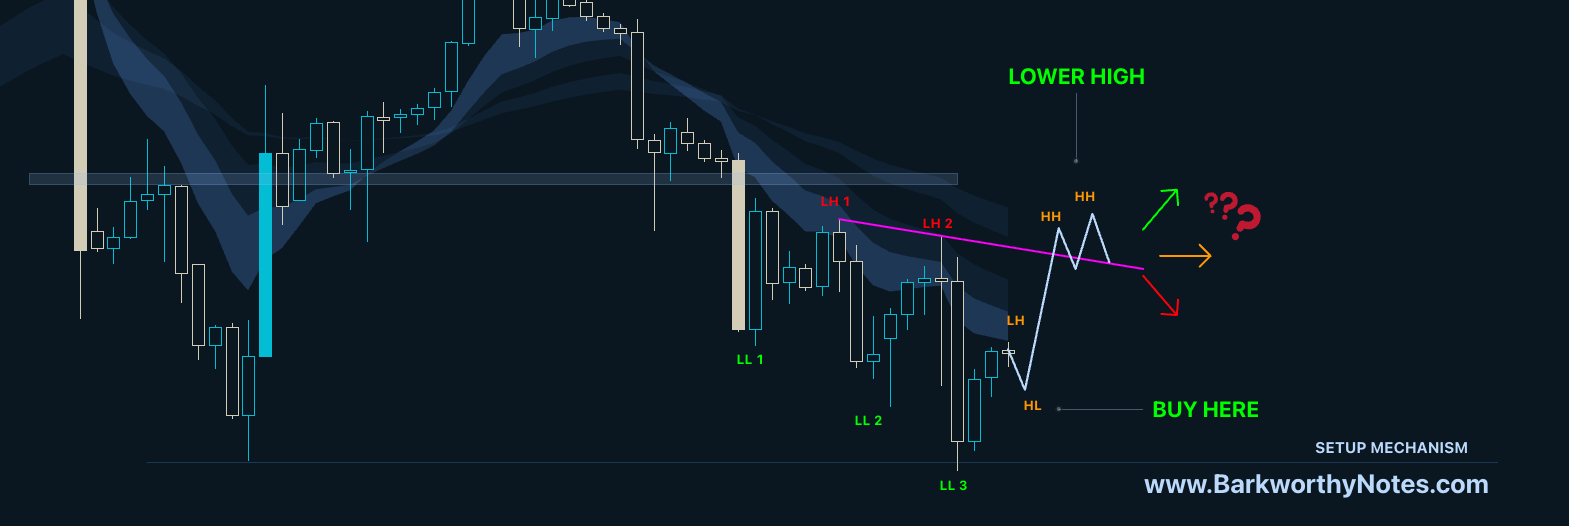
This brings us to the entry parameters. I profile myself as a reversal trader, with failed continuation my primary edge. The funny thing is that reversals depend on breakouts of the reversal setup. In the example above, the Entry Diagonal is flying high above the setup, and if we can find a way to define risk as price forms that higher low, we capture a significant portion of upside before price ever attempts a breakout.
This is the part where swing structure comes into play. The above chart is the setup. The higher low will be a downtrend on the related timeframe below — remember how I explained this in the trend structure video short. I zoomed in on the daily up-swing and found clean hourly and 4 hourly uptrends.
This principle is repeatable:
A daily pullback (D1) is a 4 hour (H4) downtrend
An H4 pullback is an H1 downtrend
An H1 pullback is an M5 downtrend
An M5 pullback is an M1/M2 downtrend.
We call these the primary relationships of Barky’s Dynamic Trend Following system.
And therefore in the current example, when we zoom in on the related timeframe below and find completed trend structure, we have context and a Diagonal Entry Model, so we can take the risk.