Walkthrough
A simple example of probability assessment, using the system
The EMA Boxes are fluid. Like moving averages, their boundaries aren’t fixed, but instead always move up and down with the last swing low and swing high. Balance zones are just that. They are clusters of wicks and pivots where we try to find the ‘bulk of the consolidation’ to estimate its boundaries, and we could look for multiple touches of levels to identify them as more significant than other levels. In the end, the only thing that matters if price wants out of a balance zone, is where price makes a new low or a new high.
Here is a visualisation of what I am trying to explain. The balance zone is just a zone. Zones don’t have specific boundaries. The EMA Box is an M2 EMA9 Box, and the boundaries move every time price looks above or below and reclaims.
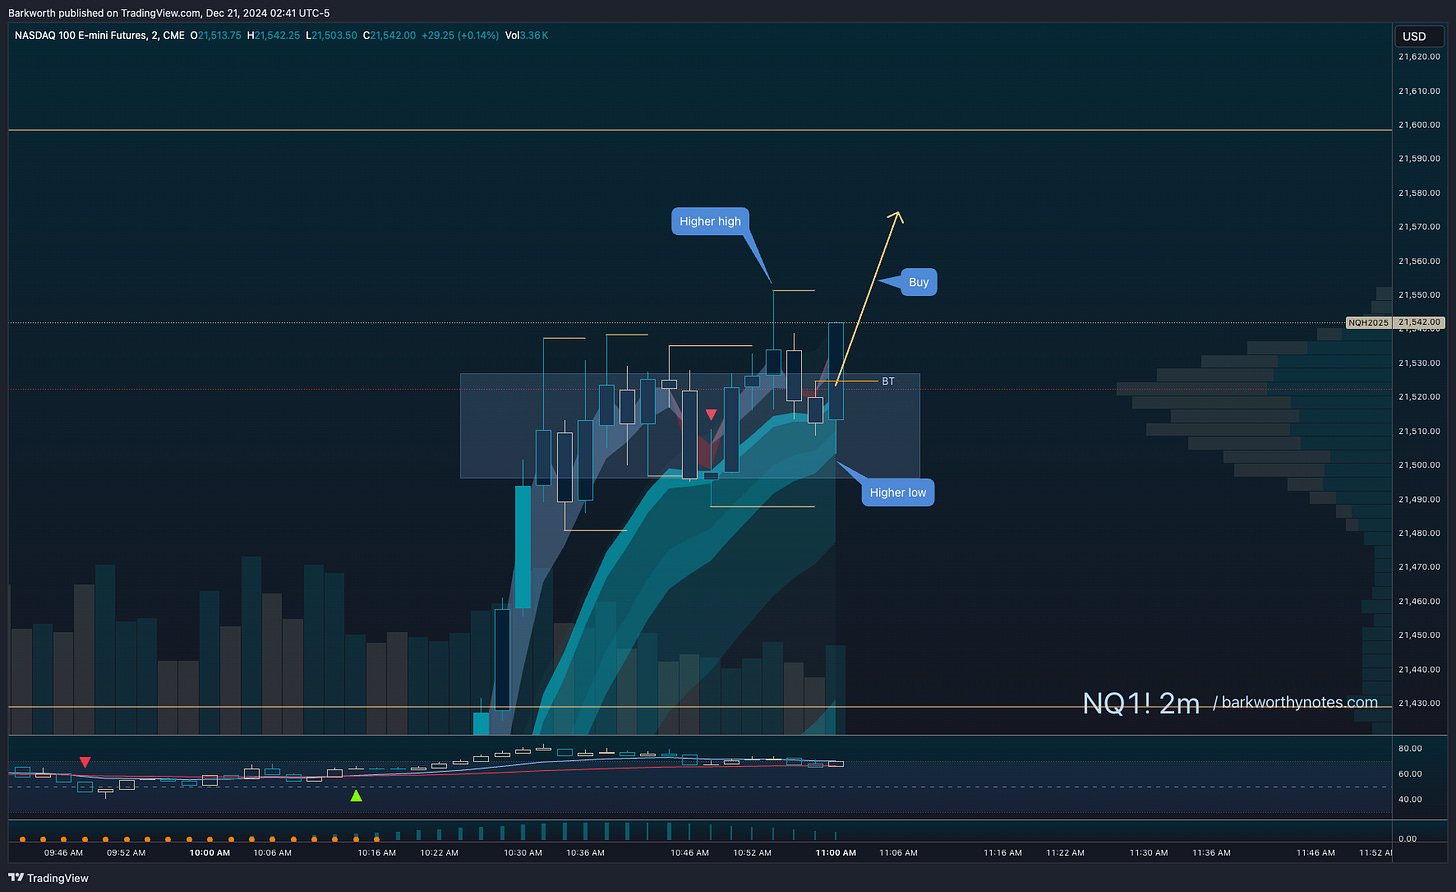
Every time price looks above and then looks back inside the range, we have potential for an entry.
Study the chart above a bit more. Why is that proposed entry an entry?
Because price is looking above the last swing high, making a higher high. Sellers have to push price back inside the range and they are trying. That is the potential higher low. If sellers fail to reach the lower boundary, the swing to the downside target fails. The definition of a failed swing, and failed swings lead away from balance zones.
Failed swings announce that there is a buyer/seller imbalance, and imbalances displace price away from balance zones.
In this case in a strong uptrend.
So this was a conviction long.
Boxes to lead the way
EMA Boxes lead the way. In fact, they lead without the EMA’s too, but the EMA’s tell us simply which timeframe is leading. I’ll admit that I primarily look at EMA9 to see if there is a trend (probability), and after a break out, to see if this trend is holding (EMA9 has to be respected to confirm momentum).
Here is a hint: a failed BT is an RT, and a failed RT is a BT.
If you can train yourself to spot ‘look above’ and ‘look back inside’, you’ll consistently be aware that an entry might be setting up, or if you should still wait.
You can use this awareness to validate an entry diagonal. An entry diagonal can be an RT or a BT, depending on where price is coming from, but if price isn’t coming from anything, a diagonal is just a support or a resistance. A diagonal becomes an entry if price is setting up a failed break down or a failed swing.
Walkthrough Example
Let’s see if I can make this concept clear with the help of a chart. I know that most beginners get confused as to what is an RT and what isn’t. In fact, when you’re new, it might seem that pretty much everything is an RT, and the study sets you up for a series of frustrating losses.
First of all, patience is key.
Second of all, without understanding the basic concepts, you can’t trade RT’s and BT’s successfully.
What I always say is that when we have a swing low and a swing high, let’s wait for something to set up. A solid M2 reversal model or M2 DEM would be a range of about 8 candles, so if you tell yourself to wait at least 10 minutes after a price makes a pivot, you’ll reduce losses tremendously.
With patience, at some point, you’ll see a broader consolidation. Like this one.
What do we see? What is the set up? There is a control bar on the left, and price is looking above that. The M2 cloud has turned and is ready to pull back, but EMA50 is trending, so any short would be a scalp. Price is looking below the old high, so if we get an entry diagonal here, we can take long with support of the EMA50.
Like this:


