


#ES_F / #NQ_F Coming Week & July 14
Mastering the S&P500 and Nasdaq 100 futures with Barky's Three Level Trade Plans

Daily Chart Update
Friday’s trade plans proposed that if price would seek higher lows first, dip below the 4 hourly entry control diagonals that we should look to participate in the backtest longs, potentially buying into failed breakdowns to trail into a search for lower highs towards Thursday’s rejection zone. Simplified, this translated to looking for failed breakdowns below the updated level 2 on both indices. Price dipped below the level and gave long during US pre-markets, then set up the hourly break outs into the US open for a solid day.
Plan result: 27 points $ES_F and 142 points $NQ_F. These trades are recapped in today’s educational section.
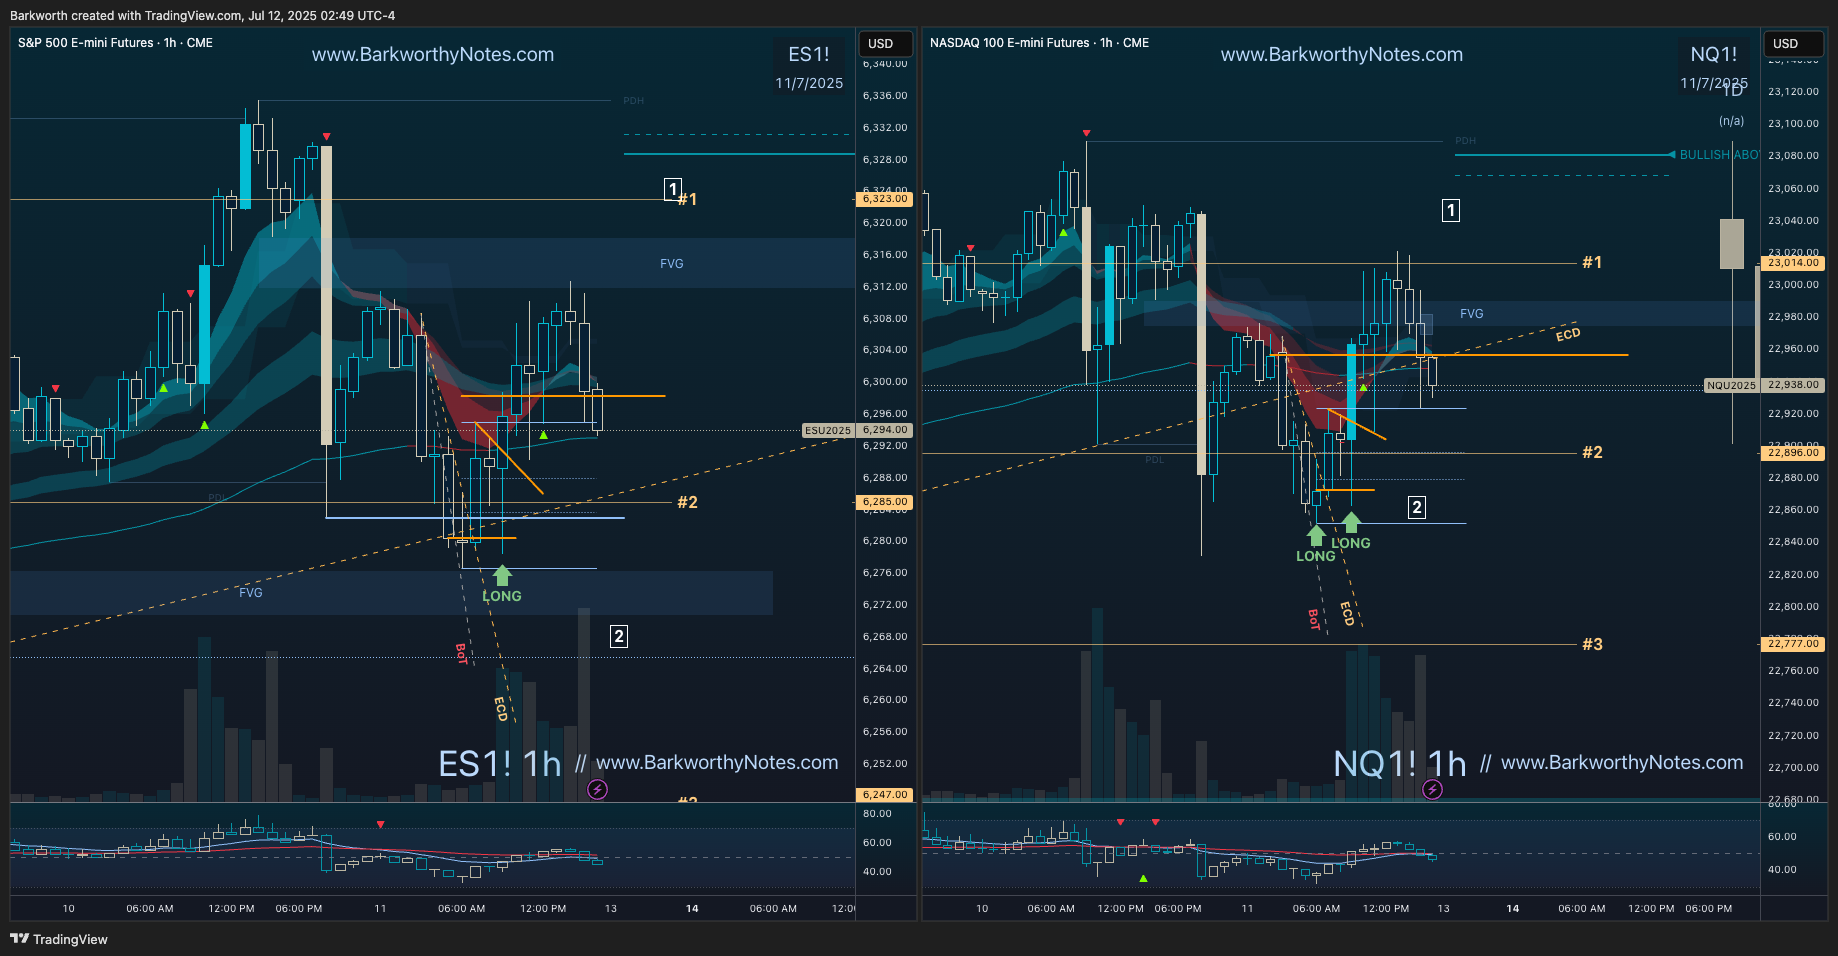
The plan for the past week was to expect consolidations or pullbacks. Both indices spent the entire week forming an hourly base into strong daily uptrends, closing the week with tight coiled, mature D1 EMA9 consolidations that are ready to break.
This week's plan centres on an "outside week," but whether the market moves up or down remains uncertain. The daily EMA9 contractions are the critical factors to watch. Today's newsletter dives deeper, outlining strategies for the week ahead, providing a three-week chart update, and detailing new trade plans for the upcoming session.

Revised levels, trade plans, trade recaps, charts, key levels, and trade plan video with video trade reviews, all in today’s newsletter.
Table of Contents
This Week’s Plan and the Coming Session;
Plan - New Three Level Trade Plans for $ES_F and $NQ_F;
$VIX - Implied Volatility (Bonus);
Video - Trade Plan Video with Previous Session Trade Recaps;
Recap Charts - Previous Session Setup Charts and Education.
For methodology, follow this link: Barky’s Three Level Trade Plans

Three Diagonals Will Change Your Life

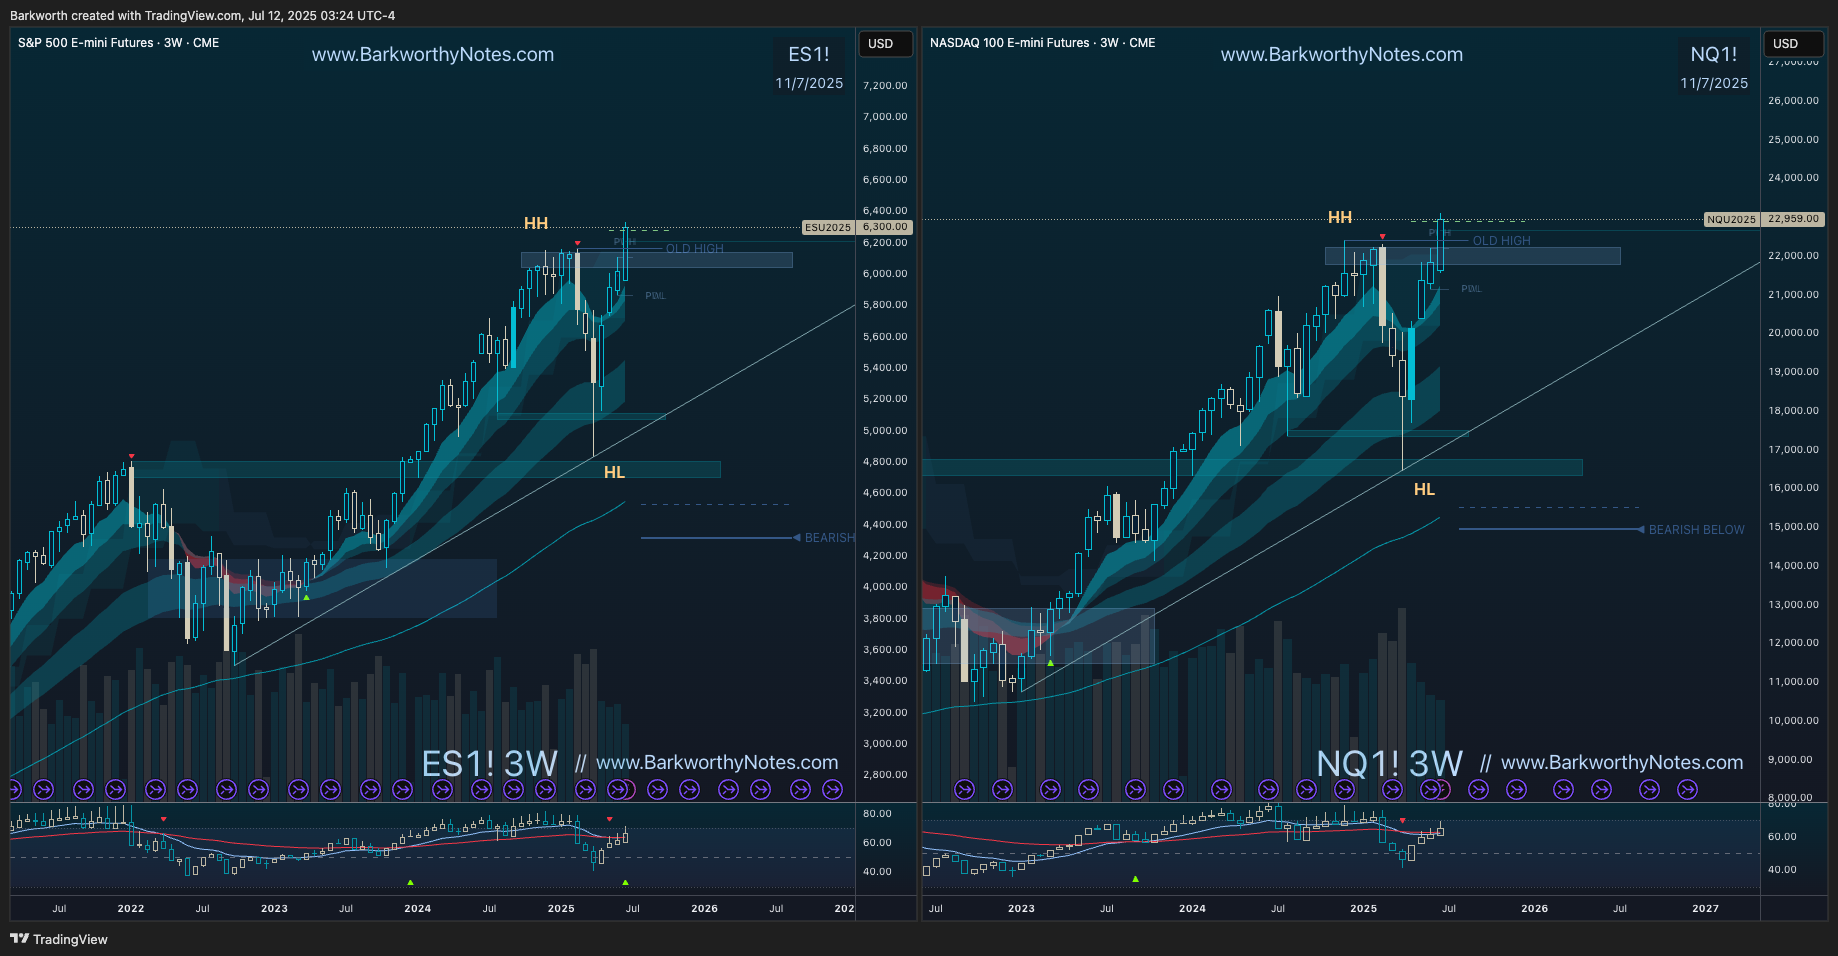
W3 Chart Update
Three weeks EMA9 leads bull markets - aligning with the weekly EMA21…
Current candle: Two weeks in, with price closing at the same levels as last week.
Bearish RSI divergence suggests consolidation or pullback ahead.
Outlook: Exhaustion confirmed and IF pullbacks materialise this week, this three week candle will close with a rejection wick.
W1 Chart Update
Chart and outlook for the coming week.
Price held the previous week’s highs, although both indices looked above the previous week’s highs and rejected, implying that a search for higher lows might be next.
The weekly market structure is bullish as long as the weekly Trend Control Diagonals (TCD) aren’t breached. As long as these uptrend lines hold, buyers control the market - learn more about TCDs here.
The third candles in these weekly break out attempts closed on indecision, confirming exhaustion, and potentially initiating the anticipated break out backtests towards internal demand zones and break out supports below.
Plan for the coming week: Expect sellers to attempt a pullback. This would initially be the dips to buy, with monthly OpEx the coming week’s main event.
Break out supports: ES $6153 - NQ $22426
Key weekly supports: ES $5959 - NQ $21567

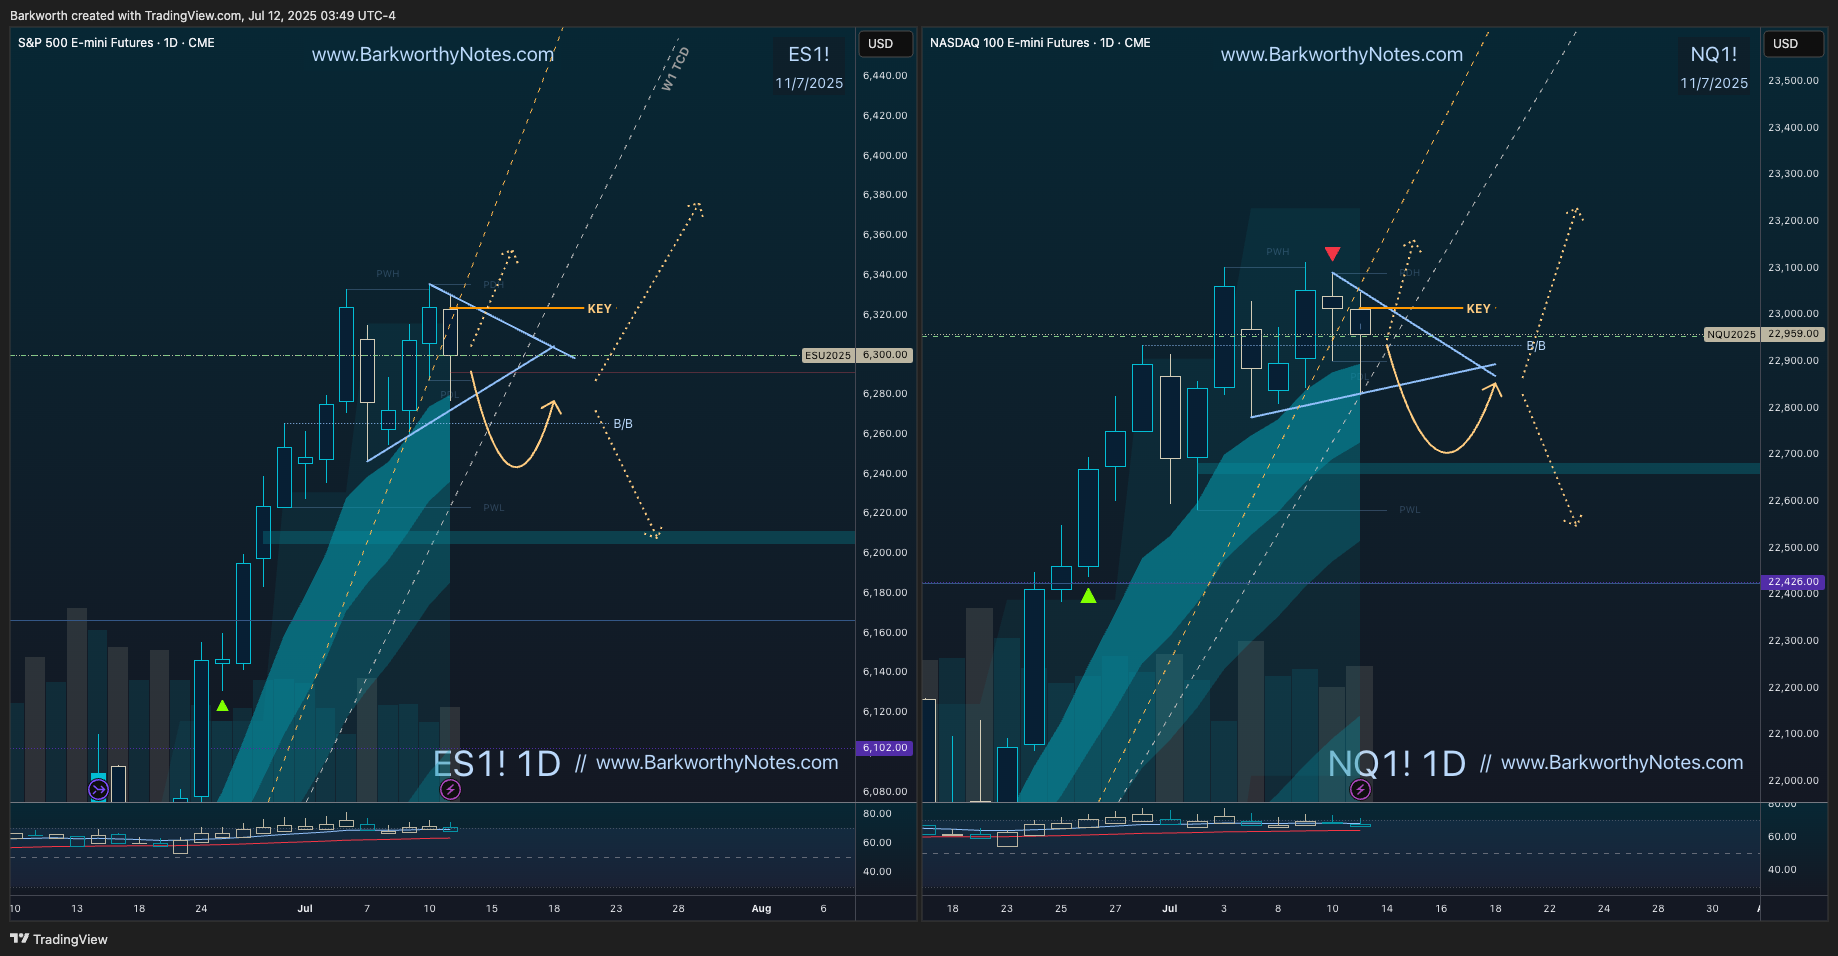
D1 - Daily chart update
RSI divergence confirmed exhaustion, but consolidation resolves this, pull backs are never guaranteed. These are daily EMA9 consolidations in strong uptrends, and they rarely fade without taking out the high at least one more time.
Key Trigger: Losing D1 EMA9 sparks pullbacks towards demand.
Pullback Targets: D1 EMA14 aligns weekly Trend Control Diagonals and the projected demand zones.

Plans for the Coming Session
During uptrends it is always the EMA9 push that produces continuation. Those were the dips we bought on Monday last week. When these continuation attempts fails, the turns initiate - with EMA14 the next area to produce the long. When bounces from EMA14 fail, price will challenge the EMA21, and when that happens, EMA9 typically becomes resistance.
Therefore dips into D1 EMA14 should be considered ‘bullish higher lows’ - and if we get these, I will be looking to buy.
We have been managing these daily turns on the 4 hourly chart, and with Friday’s confirmed 4 hourly lower highs, sellers are in control to target demand zones below, with H4 EMA9 leading.
Bullish Setup: Long to attempt immediate continuation.
Bearish Setup: Short to backtest D1 EMA14 for daily higher lows.
Bullish Reversal Triggers:
- failing to break and hold below last week’s lows signals failed breakdowns;
- failing to break and hold below Friday’s lows signals failed breakdowns.
Barky’s Three Level Trade Plans provide precise entries to navigate these setups.
Unlock Winning Trades for Just $12/Month!
Get Barky’s Three Level Trade Plans for ES and NQ, plus exclusive charts, precise levels, trade plan videos, and session recaps. Don’t miss this week’s breakout setups - subscribe now!