

Trading Courses
An edge to approach the markets with an iron mindset…

Learn DEM and DTF through four comprehensive courses with well over twenty four detailed classes and instructions.
The progression is simple, and after the first articles, you can immediately start to practice your entries and stops. In a broad overview, here is how the course is organised:
First course: the basic model, risk management and position sizing;
Second course: trend following and the advanced model;
Third course: dynamic trend following (across timeframes);
Fourth course: the entry model in standard patterns;
Examples and studies.
In short, the first course teaches the trading basics (entry, the stop and position sizing). The second course teaches the system step by step, and with more technical details.
The third course demonstrates the Diagonal Entry Model intra timeframe, and then the fourth and final course explains how to use the entry model when you recognise basic patterns, such as Head and Shoulder, Cup and Handle, Triangle, etc.
Navigate the index below, and click on the instruction of your selection.
Setting Up Your Charts
Before getting started, copy my chart setup and indicators.

Now you’re all set, but you might want to keep a list of my terminology at hand.

Beginners
Beginners should start with the first course to get that critical understanding of risk management and position sizing, and then at first really only focus on the LTF DEM. The LTF DEM is the pillar of the system, the bread and butter, and the main money maker. Once you understand this model and have practised it a few months, you’ll start to recognise repeatable things, and you’ll be able to study additional concepts.
Don’t force it. Be patient, and take all the time you need.
First Course: The Basics
The first series of instructions explain the basic model and the risk- and position management tools you need to get started.
The basic Diagonal Entry Model.

No profitability without risk management.

Fixed risk, variable position size: learn how to use position size to create standard risk and compound gains, even when trades fail.
Patience is key. This is a marathon, not a sprint. Keep a steady pace, and don’t make exceptions. Most people blow their emotional capital because they are impatient. You can grow a $100 account into $1000 in just 10 to 20 trades, but the majority of traders can't do this because they are impatient and start taking too much risk, giving back gains from earlier trades and destroying their confidence. Focus on % not $.

How to shift between timeframes to identify the leading EMA9, and how to wait for that perfect moment to enter.

Day trading with the Diagonal Entry Model.
Focus on this single model and master it. Take your 5 to 10 points every day, and confidently increase size. That is all you have to do to make a living. Imagine taking 5 points with 100 contracts. 1000 contracts. This is the dream, this is the goal. But for now, just practise with 2 contracts so that you can leave a risk free runner. Practise with a small account, fix your trading issues, and then start scaling.

How position sizing and balanced risk help you compound gains and grow your account.

How risk management turned a solid profit out of 4 failed trades and 1 win.

Moving towards the second course, a first look at the relationship between the EMA9 and the EMA50.

First Course Appendix
A technical concept of the relationship between the three diagonals and how one single fractal holds the key to all market behaviour.

Context and the Complete System - where to look for diagonal entries and a first look at the concepts of the second course.

Second Course: Trend Following
Introduction.

This second course is going to take you deep into price action, and for beginners, the amount of information may seem overwhelming. Take your time to read through the information casually, so that you get a general idea of these technical concepts.
At any point, you can skip down towards the examples section and study that walkthrough where I highlight how the BT and RT concepts validation diagonals as entries or targets.
Support and resistance, demand and supply: the key to market behaviour.

Contraction and expansion, the key to directional trading.

A first look at reversals and the RT Entries.

Reversal Trigger Concepts - How to trade the EMA Dance.

How imbalances set up the Diagonal Entry Model.

See how all instructions combine into a single concept that leads the way.

Basic S/R flipping to confirm if you should hold your runners or not.

The same imbalances that give EMA Boxes, allow us to project targets.

Where to place the HH or LL along EMA9 trends.

Second Course Appendix
Understanding the relationship between EMA’s and trend structure.

When an EMA50 Push succeeds, you won’t get an EMA50 RT.

The EMA9 and EMA50 dynamic across timeframes and relationships during contraction and expansion.

Third Course: Dynamic Trend Following
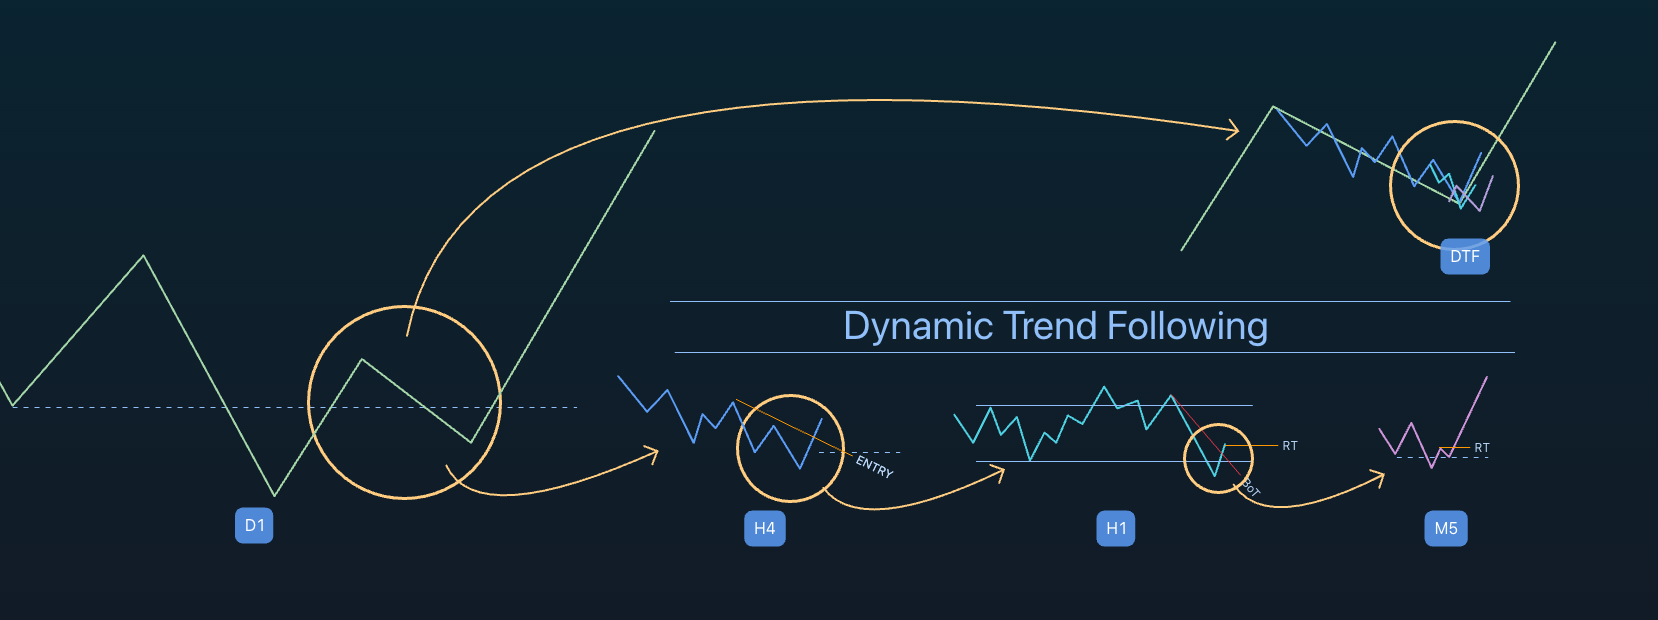
Introduction

RT Concepts lead the way, constantly telling us which EMA9 has to lead, allowing us to follow the leading trend as it spreads up and down through timeframes.

Failed swings produce higher lows and lower highs to set up the entry.

Ultimate DTF execution: Identifying price location through the use of EMA Boxes.

Using Stage 1 and Stage 2 to estimate the duration of Stage 3.

Simplifying intra timeframe awareness, using what we have learned.

Third Course Appendix
How to identify strong supply and demand zones.

Execution
Thoughts, insights and instructions that demonstrate how to apply what you have learned
An understanding of flag structures will also help you understand where a DEM entry confirms a break out.

How I designed my system, using DTF to find context for lower timeframe trades

Examples
Price action only reverses in two ways: failed breaks and failed swings. There are no exceptions to this rule, which is why the RT and BT concepts are so powerful. If you can train yourself to spot failed breaks and their subsequent targets, you’ll understand the difference between an exit area, an entry, a failed swing and a failed break.
In reality, learning these concepts can be challenging, but since the principles area always the same, once you understand it, you start to see it everywhere.
RT and BT concepts validate entry diagonals versus support or resistance diagonals. The question is always, where is price coming from, so is this diagonal break a failed swing, a reversal trigger, or simply a ‘look above or below’?
I have created a detailed walkthrough of two setups, to explain how this works.

For more examples the Discord offers a library with example charts, studies of existing models, and potential new parameters and/or edges.
We even have video instructions for full members.


Museum: Additional Articles
Some of these are newer, some of these are older. Some of these are due for review, while others can simply be left behind. There is lots of knowledge to be had here, and for now, I want to keep these articles on file. Some of these will be revisited and become part of the fourth course.
A look at what will soon become my Power Model

LTF DEM parameters for long scalps.

LTF DEM parameters for short scalps

Miscellaneous thoughts.

What Ultimately Become the Base Box Sequence and Base Box Timing: